Step 1. Set up Managed Logging in the GCore customer portal
To enable OpenSearch integration with Grafana, you need to configure Managed Logging in the Gcore Customer Portal. You can find more information in our guide on configuring Managed Logging and viewing your logs.Step 2. Install OpenSearch plugin in Grafana
If you’ve already installed the plugin, skip these instructions and go to Step 3. To install the plugin: 1. In Grafana, navigate to the Administration section and click Plugins. 2. Search for the OpenSearch plugin. In the State dropdown, check that All is selected. Otherwise, you won’t see the plugin in search results. 3. Click Install.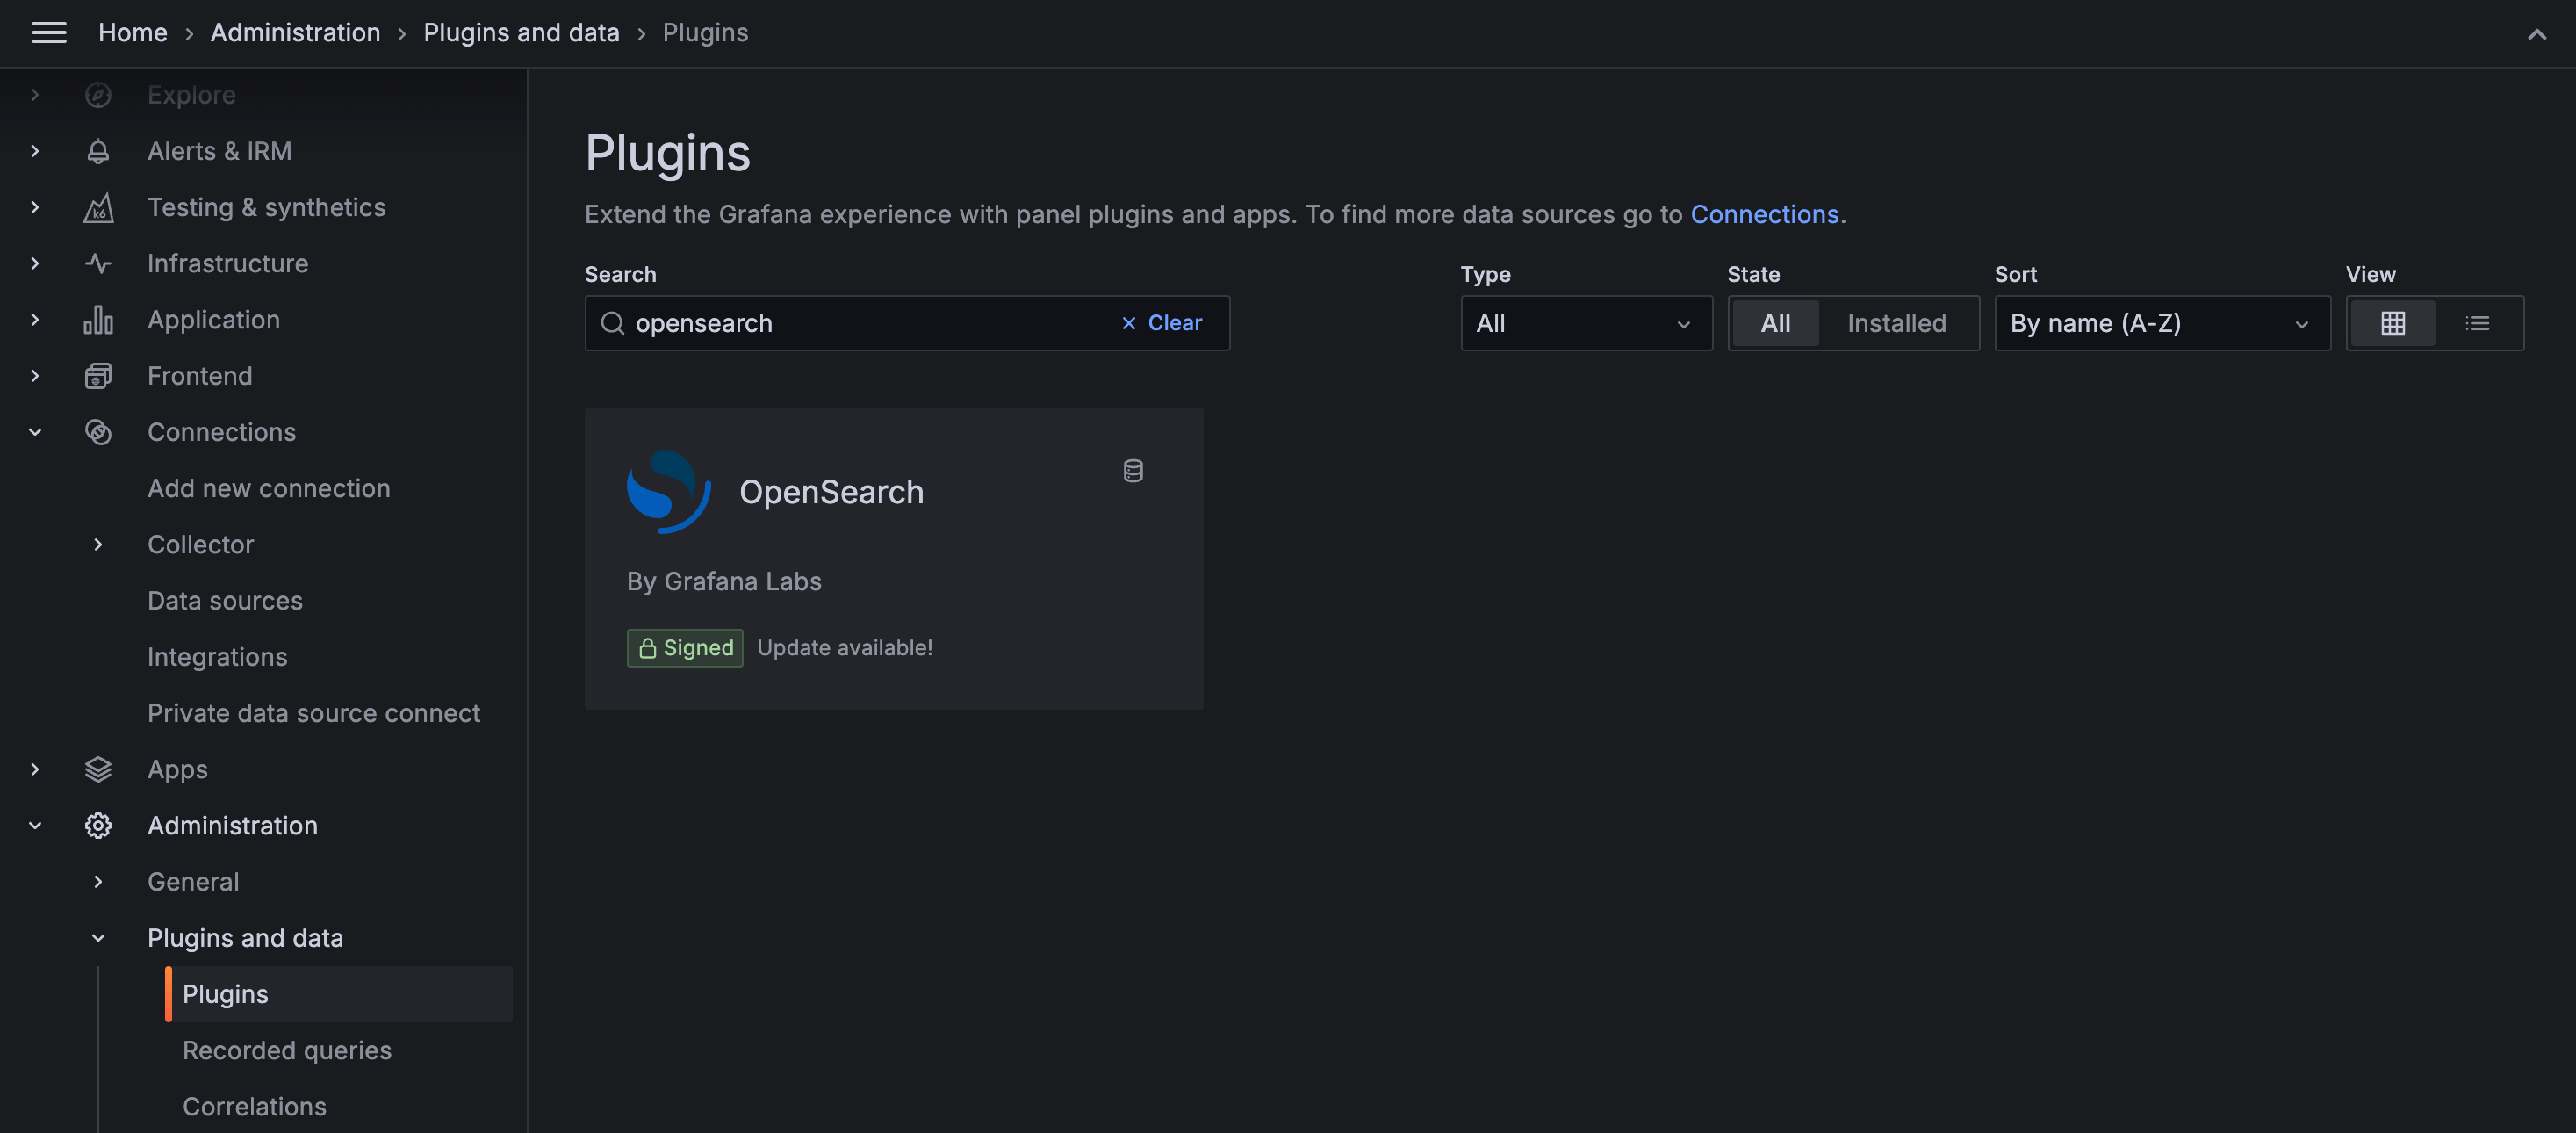
Step 3. Configure the OpenSearch plugin to display logs in Grafana
1. Open the plugin in Grafana. 2. In the top-right corner of the screen, click Add new data source.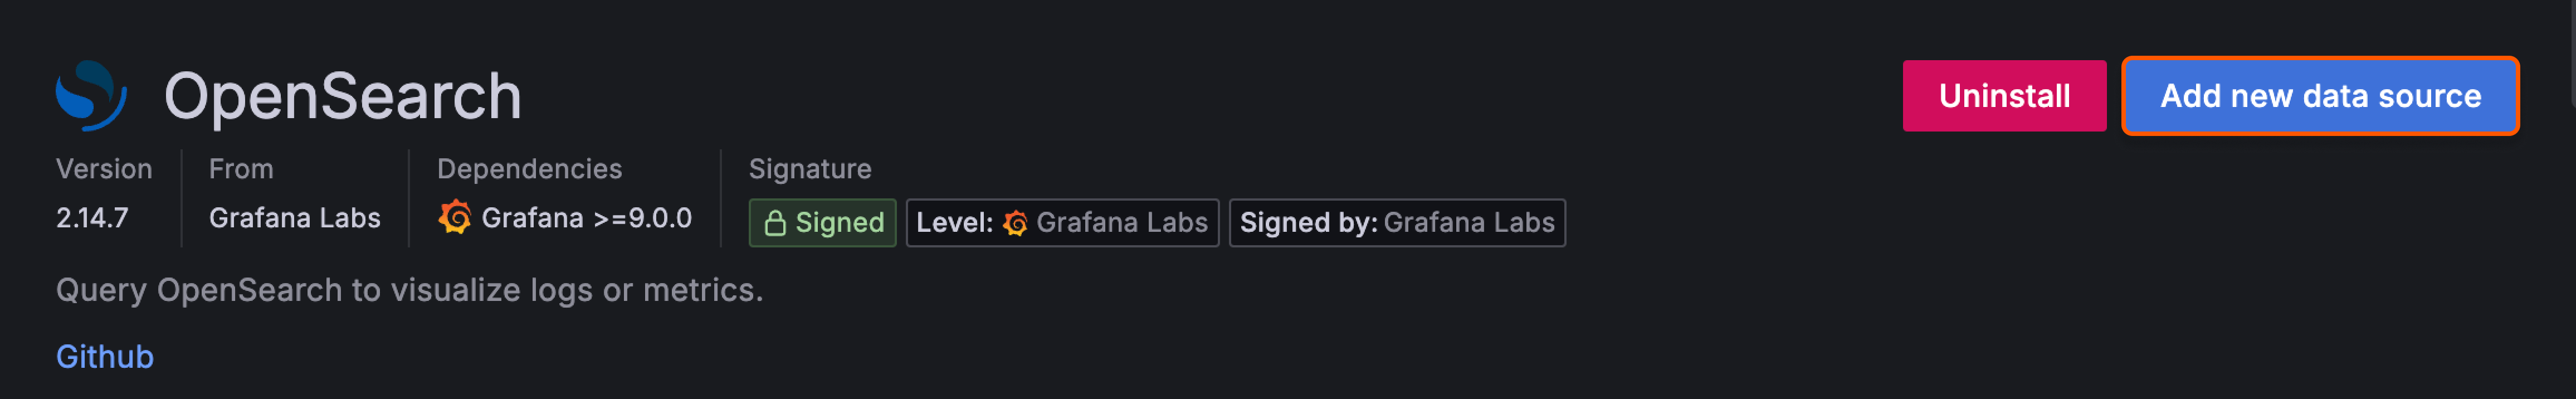
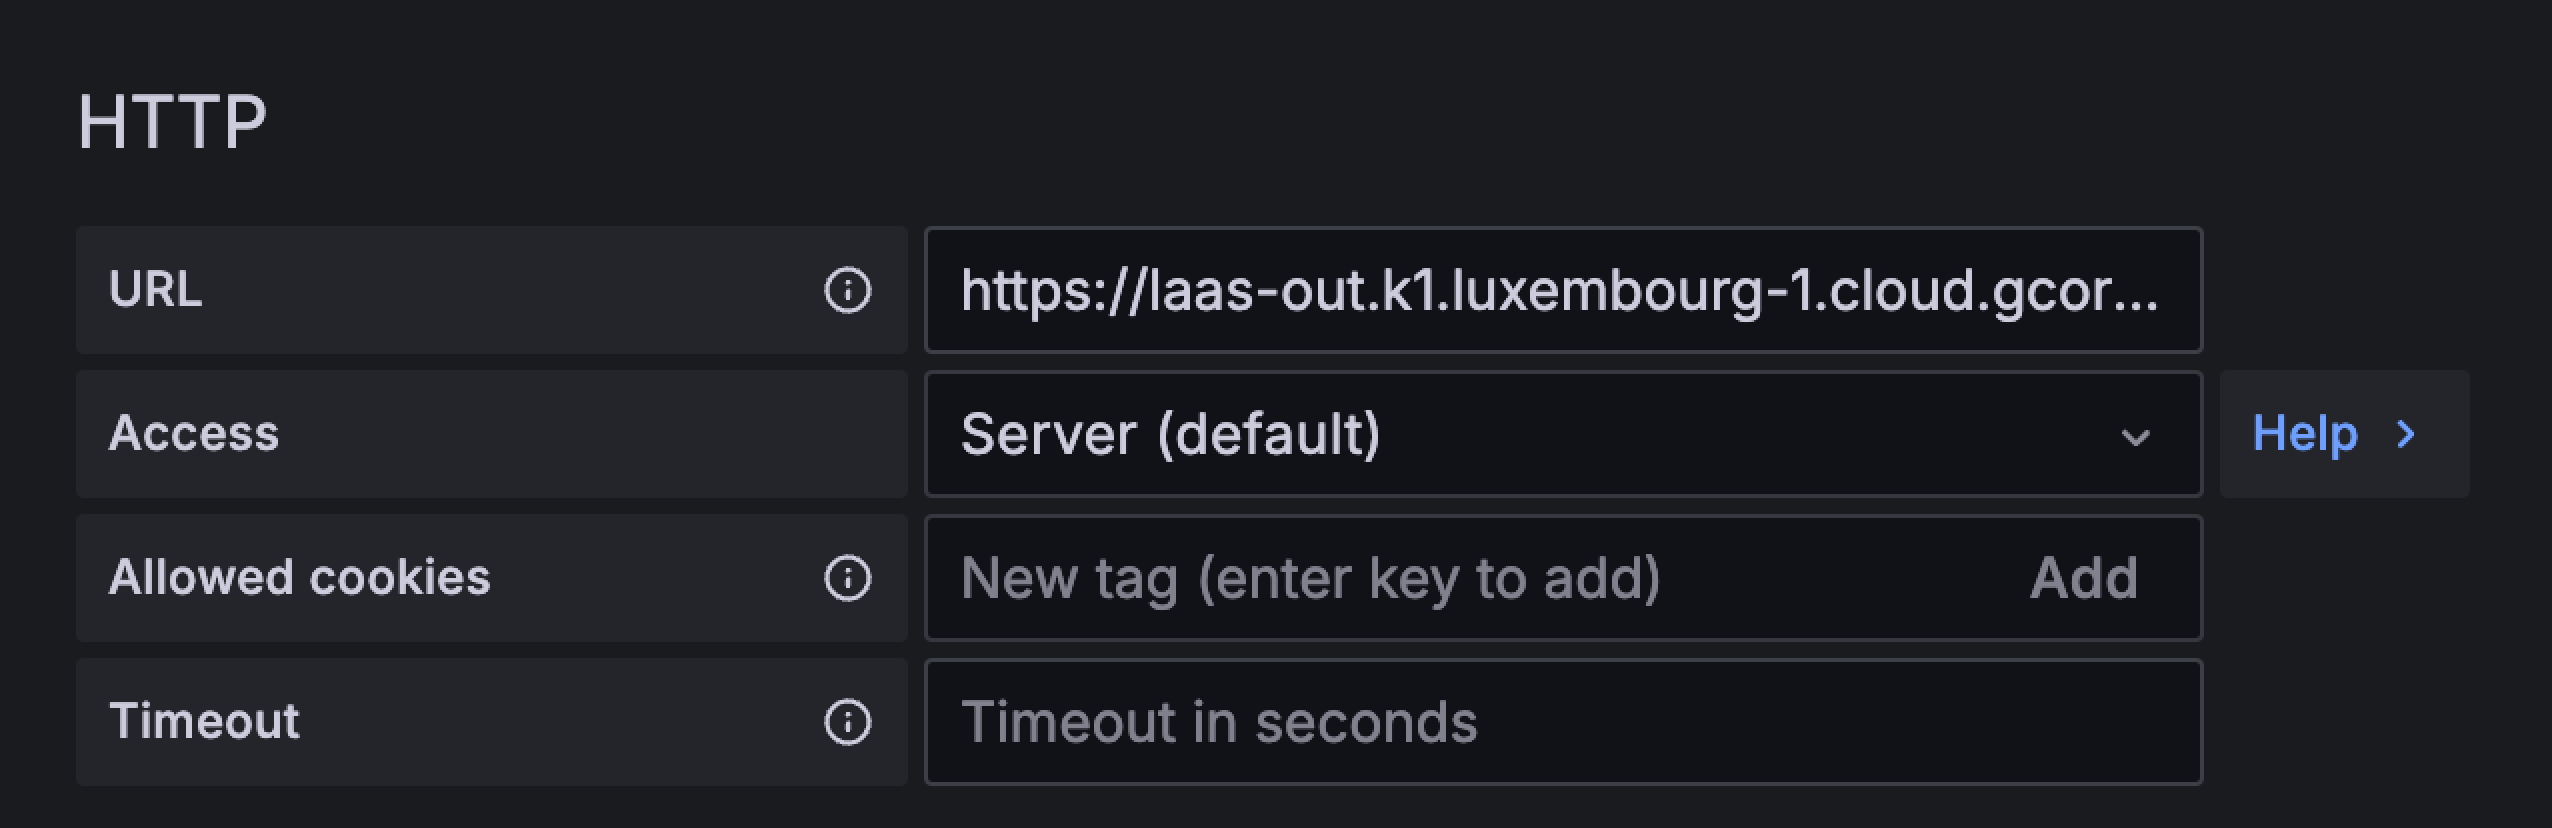
- URL : Enter the link of OpenSearch API endpoint. You can find the link in the Gcore Customer Portal on the Logging page.
- Access : If you select “Server (default)”, the URL will be accessible from the Grafana backend/server. If you choose “Browser”, the URL will be accessible from the browser.
- Allowed cookies : Specify which cookies are allowed to be included in requests to the OpenSearch endpoint.
- Timeout : Set the maximum waiting time for a response from OpenSearch. This will determine how long Grafana will wait for a response before terminating the connection.
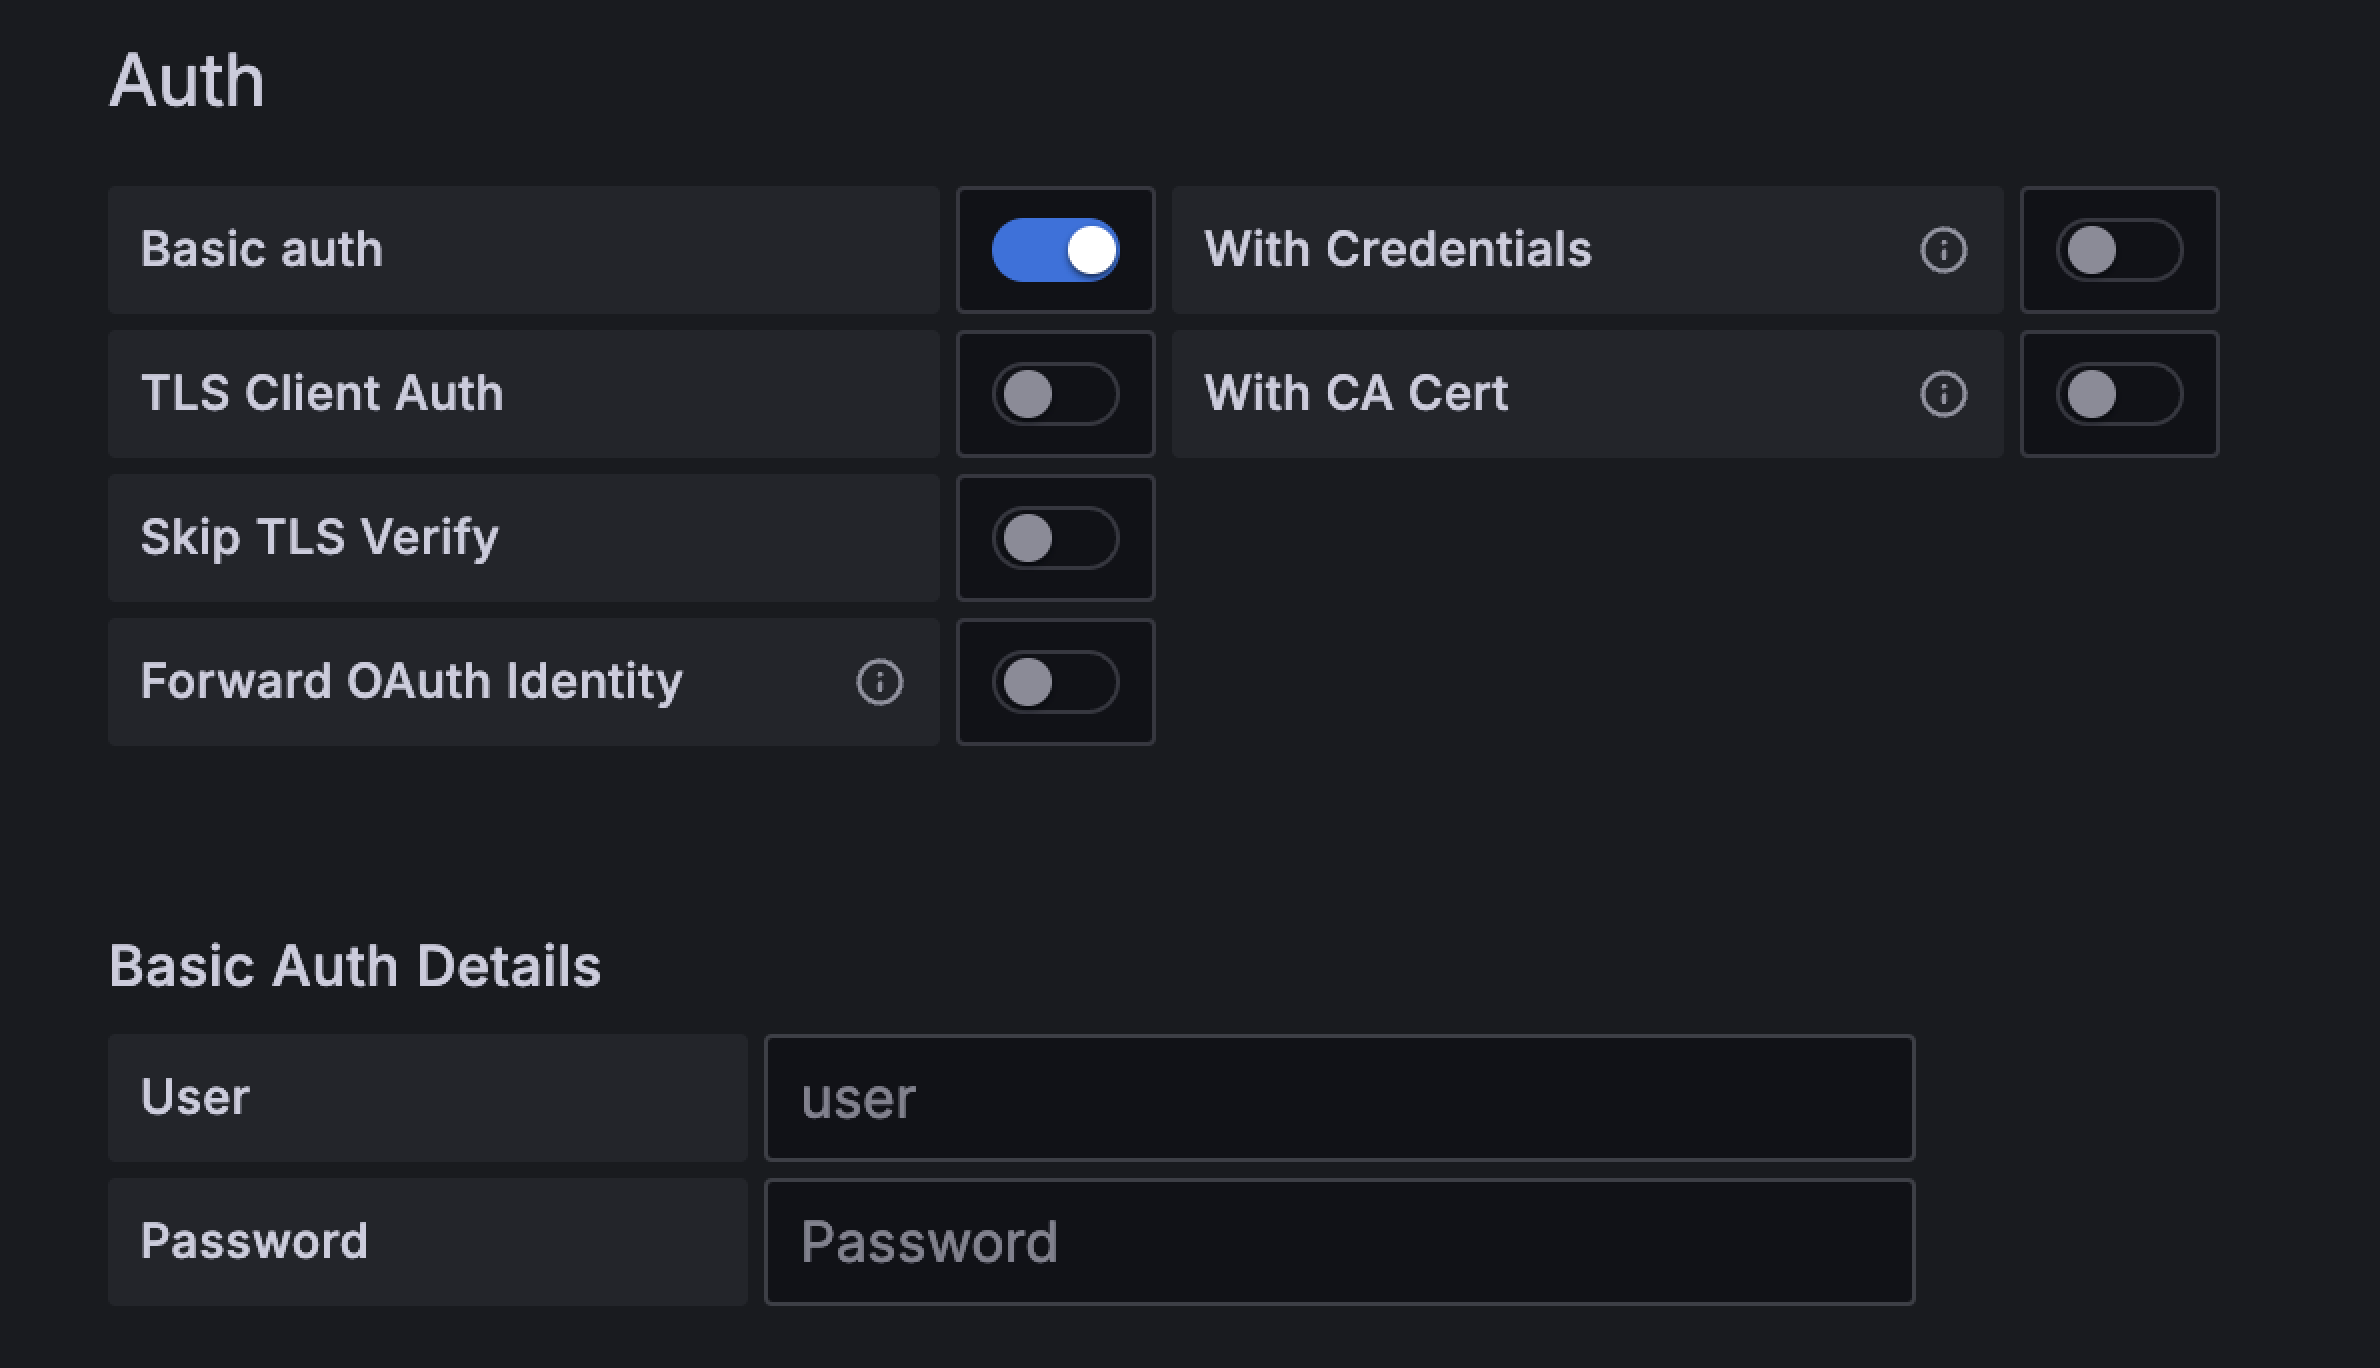
InfoAfter you select “Basic auth”, you might see the following error: “OpenSearch error: no permissions for [indices:admin/mappings/get] and User [name=test2, backend_roles=[], requestedTenant=null]”.This error doesn’t affect the plugin. Ignore it and proceed with the next steps.
Step 3. View your logs in Grafana
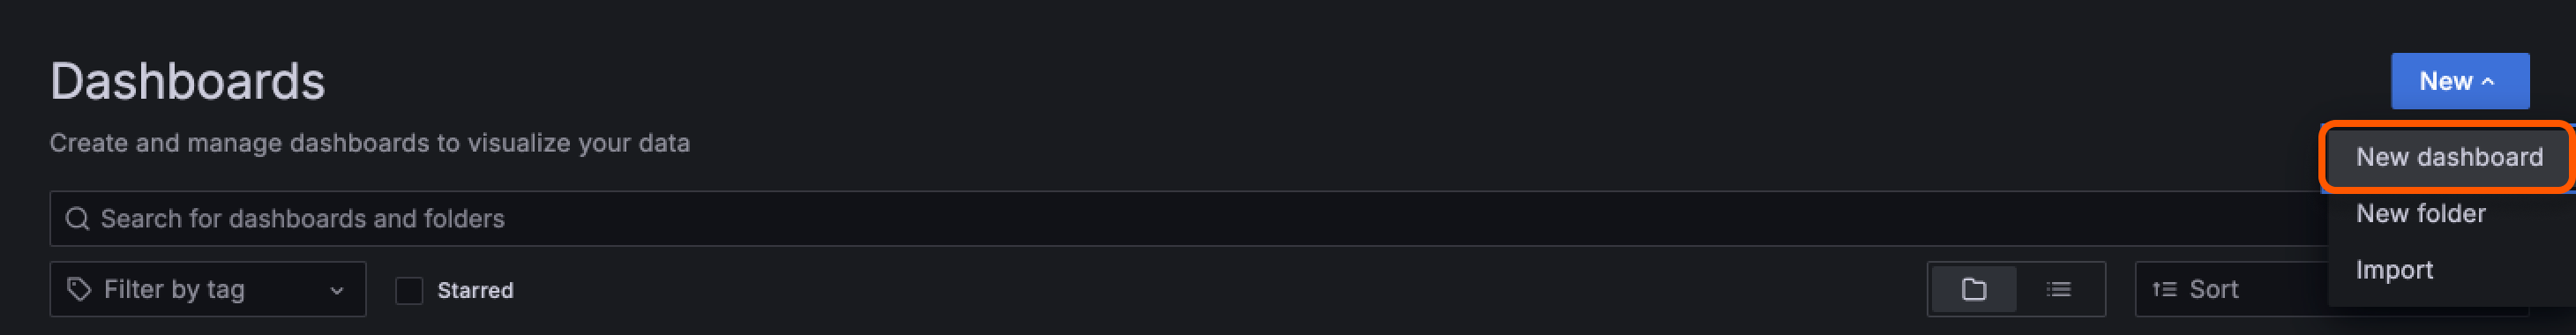
The following instructions explain how to create a new dashboard in Grafana and use it to display your log data. You can find detailed instructions on how to use and manage dashboards in the official Grafana guide. To display logs on a new Grafana dashboard: 1. In the sidebar, click Dashboards. 2. In the top-right corner of the screen, click New > New dashboard.