Advantages of WebRTC and conversion to HLS/DASH
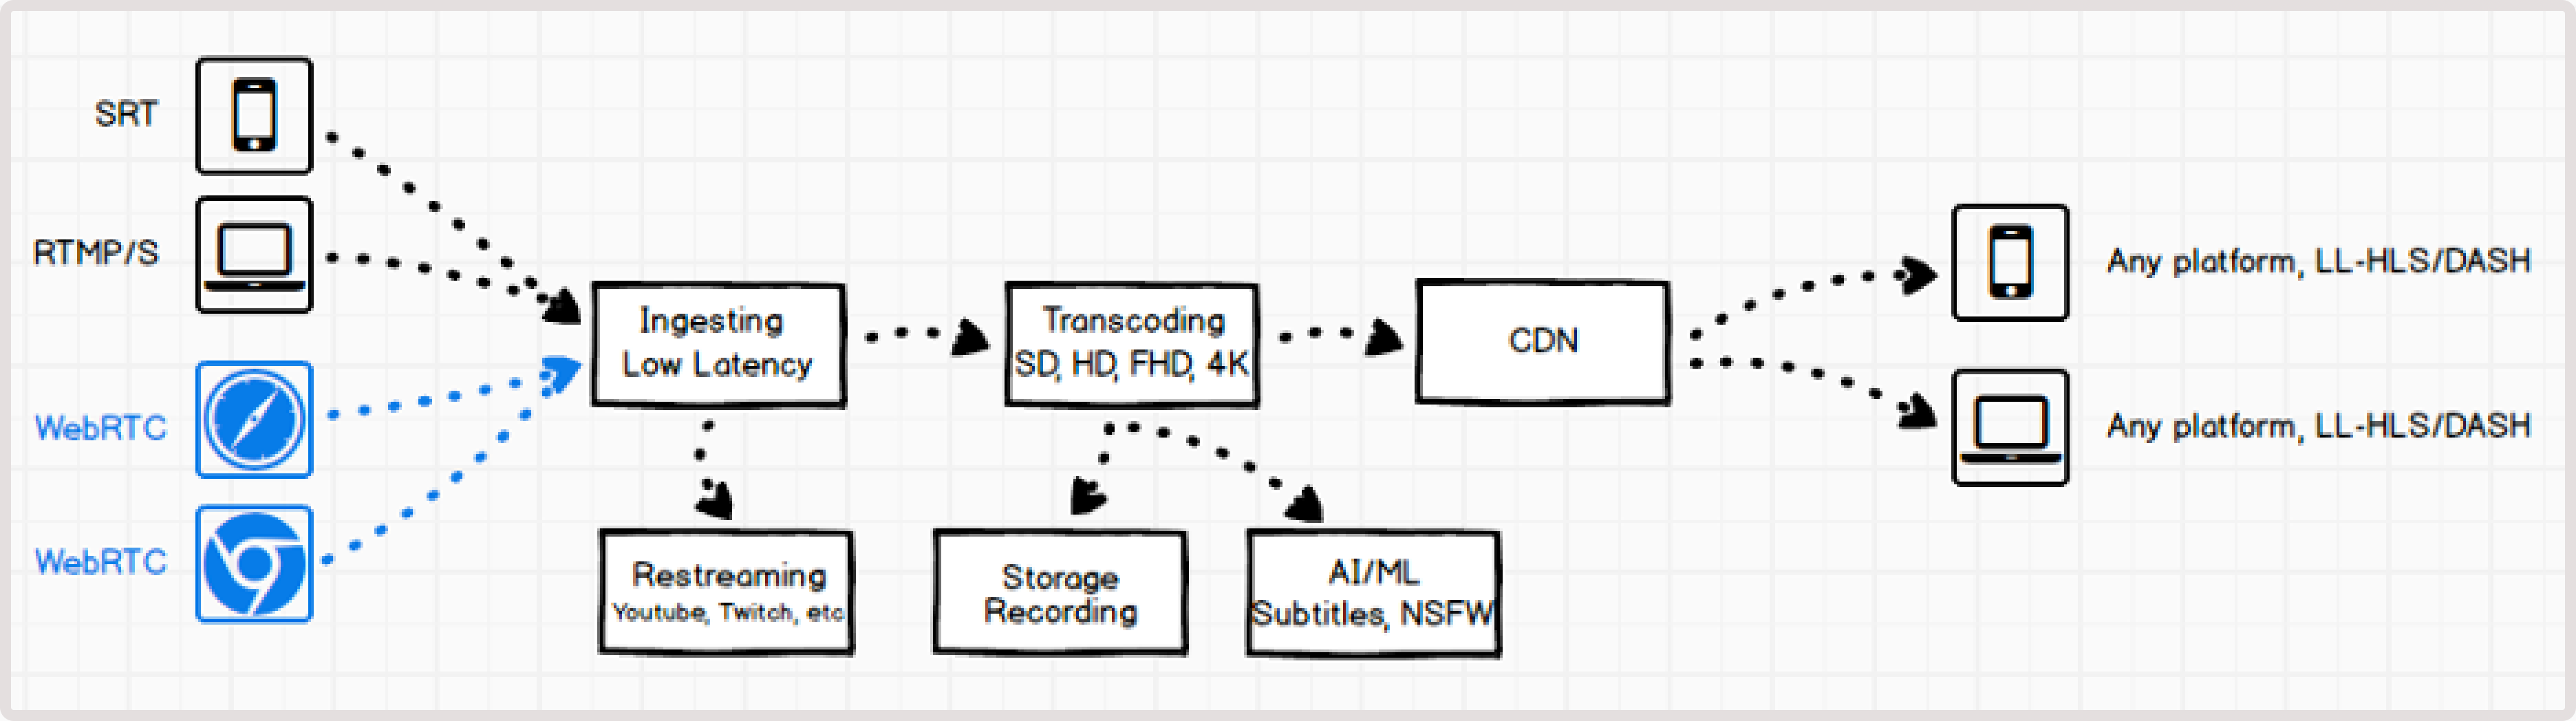
WebRTC ingest for streaming offers two key advantages over traditional RTMP and SRT protocols: 1. It runs directly in the presenter’s browser, so no additional software is needed. 2. WebRTC can reduce stream latency. By using WebRTC WHIP for ingest, you can convert WebRTC to HLS/DASH playback, which provides the following benefits:- Fast ingest via WebRTC from a browser.
- Optimal stream distribution using HLS/DASH with adaptive bitrate streaming (ABR) through the CDN.
How it works
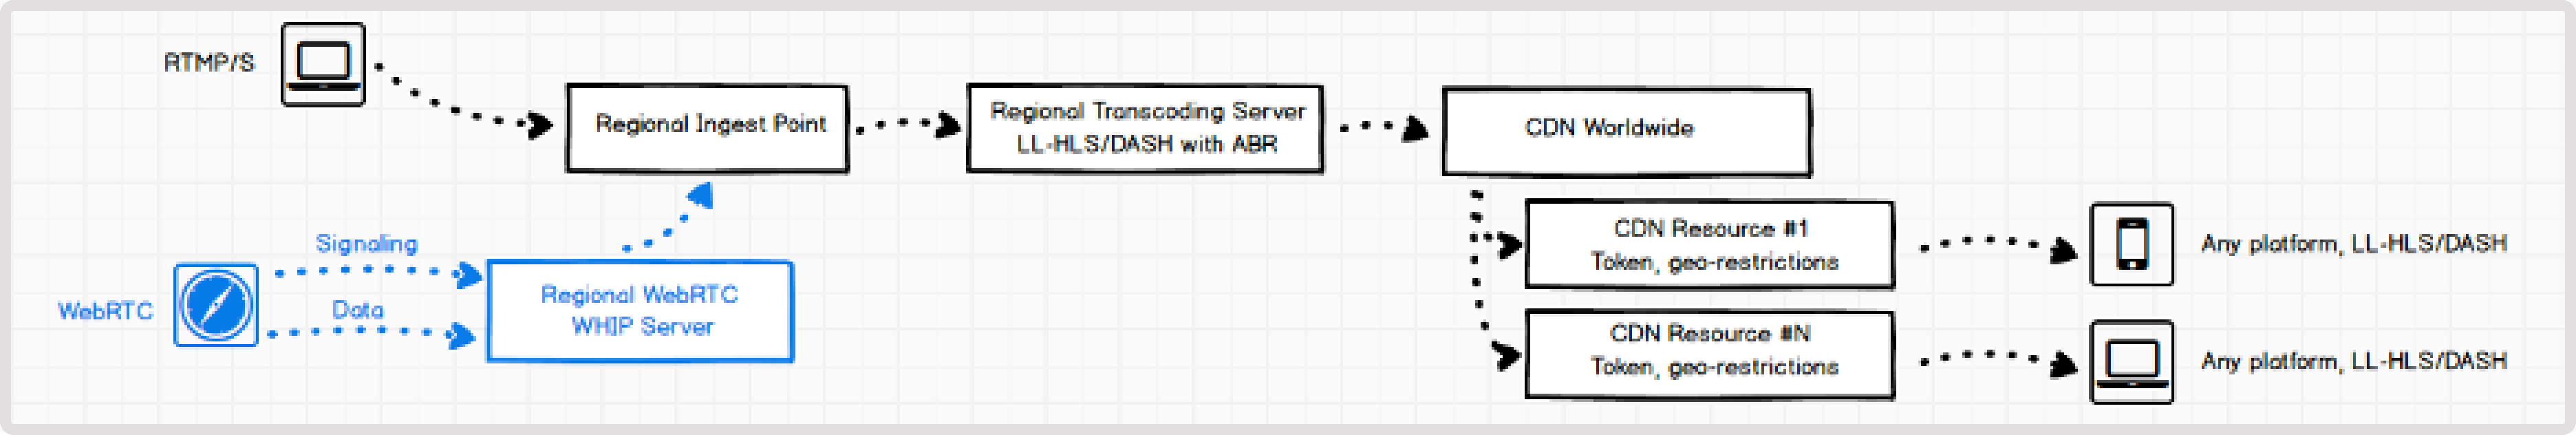
We use a dedicated WebRTC WHIP server to manage WebRTC ingest. This server handles both signaling and video data reception. Such a setup allows you to configure WebRTC on demand and continue to use all system capabilities to set up transcoding and delivery via CDN. The RTC WHIP server organizes signaling and receives video data. Signaling refers to the communication between WebRTC endpoints that are necessary to initiate and maintain a session. WHIP is an open specification for a simple signaling protocol that starts WebRTC sessions in an outgoing direction, such as streaming from your device. We use local servers in each region to ensure a minimal route from a user-presenter to the server.WebRTC stream encoding parameters
The stream must include at least one video track and one audio track:- Video must be encoded using H.264.
- Audio must use OPUS codec.
-
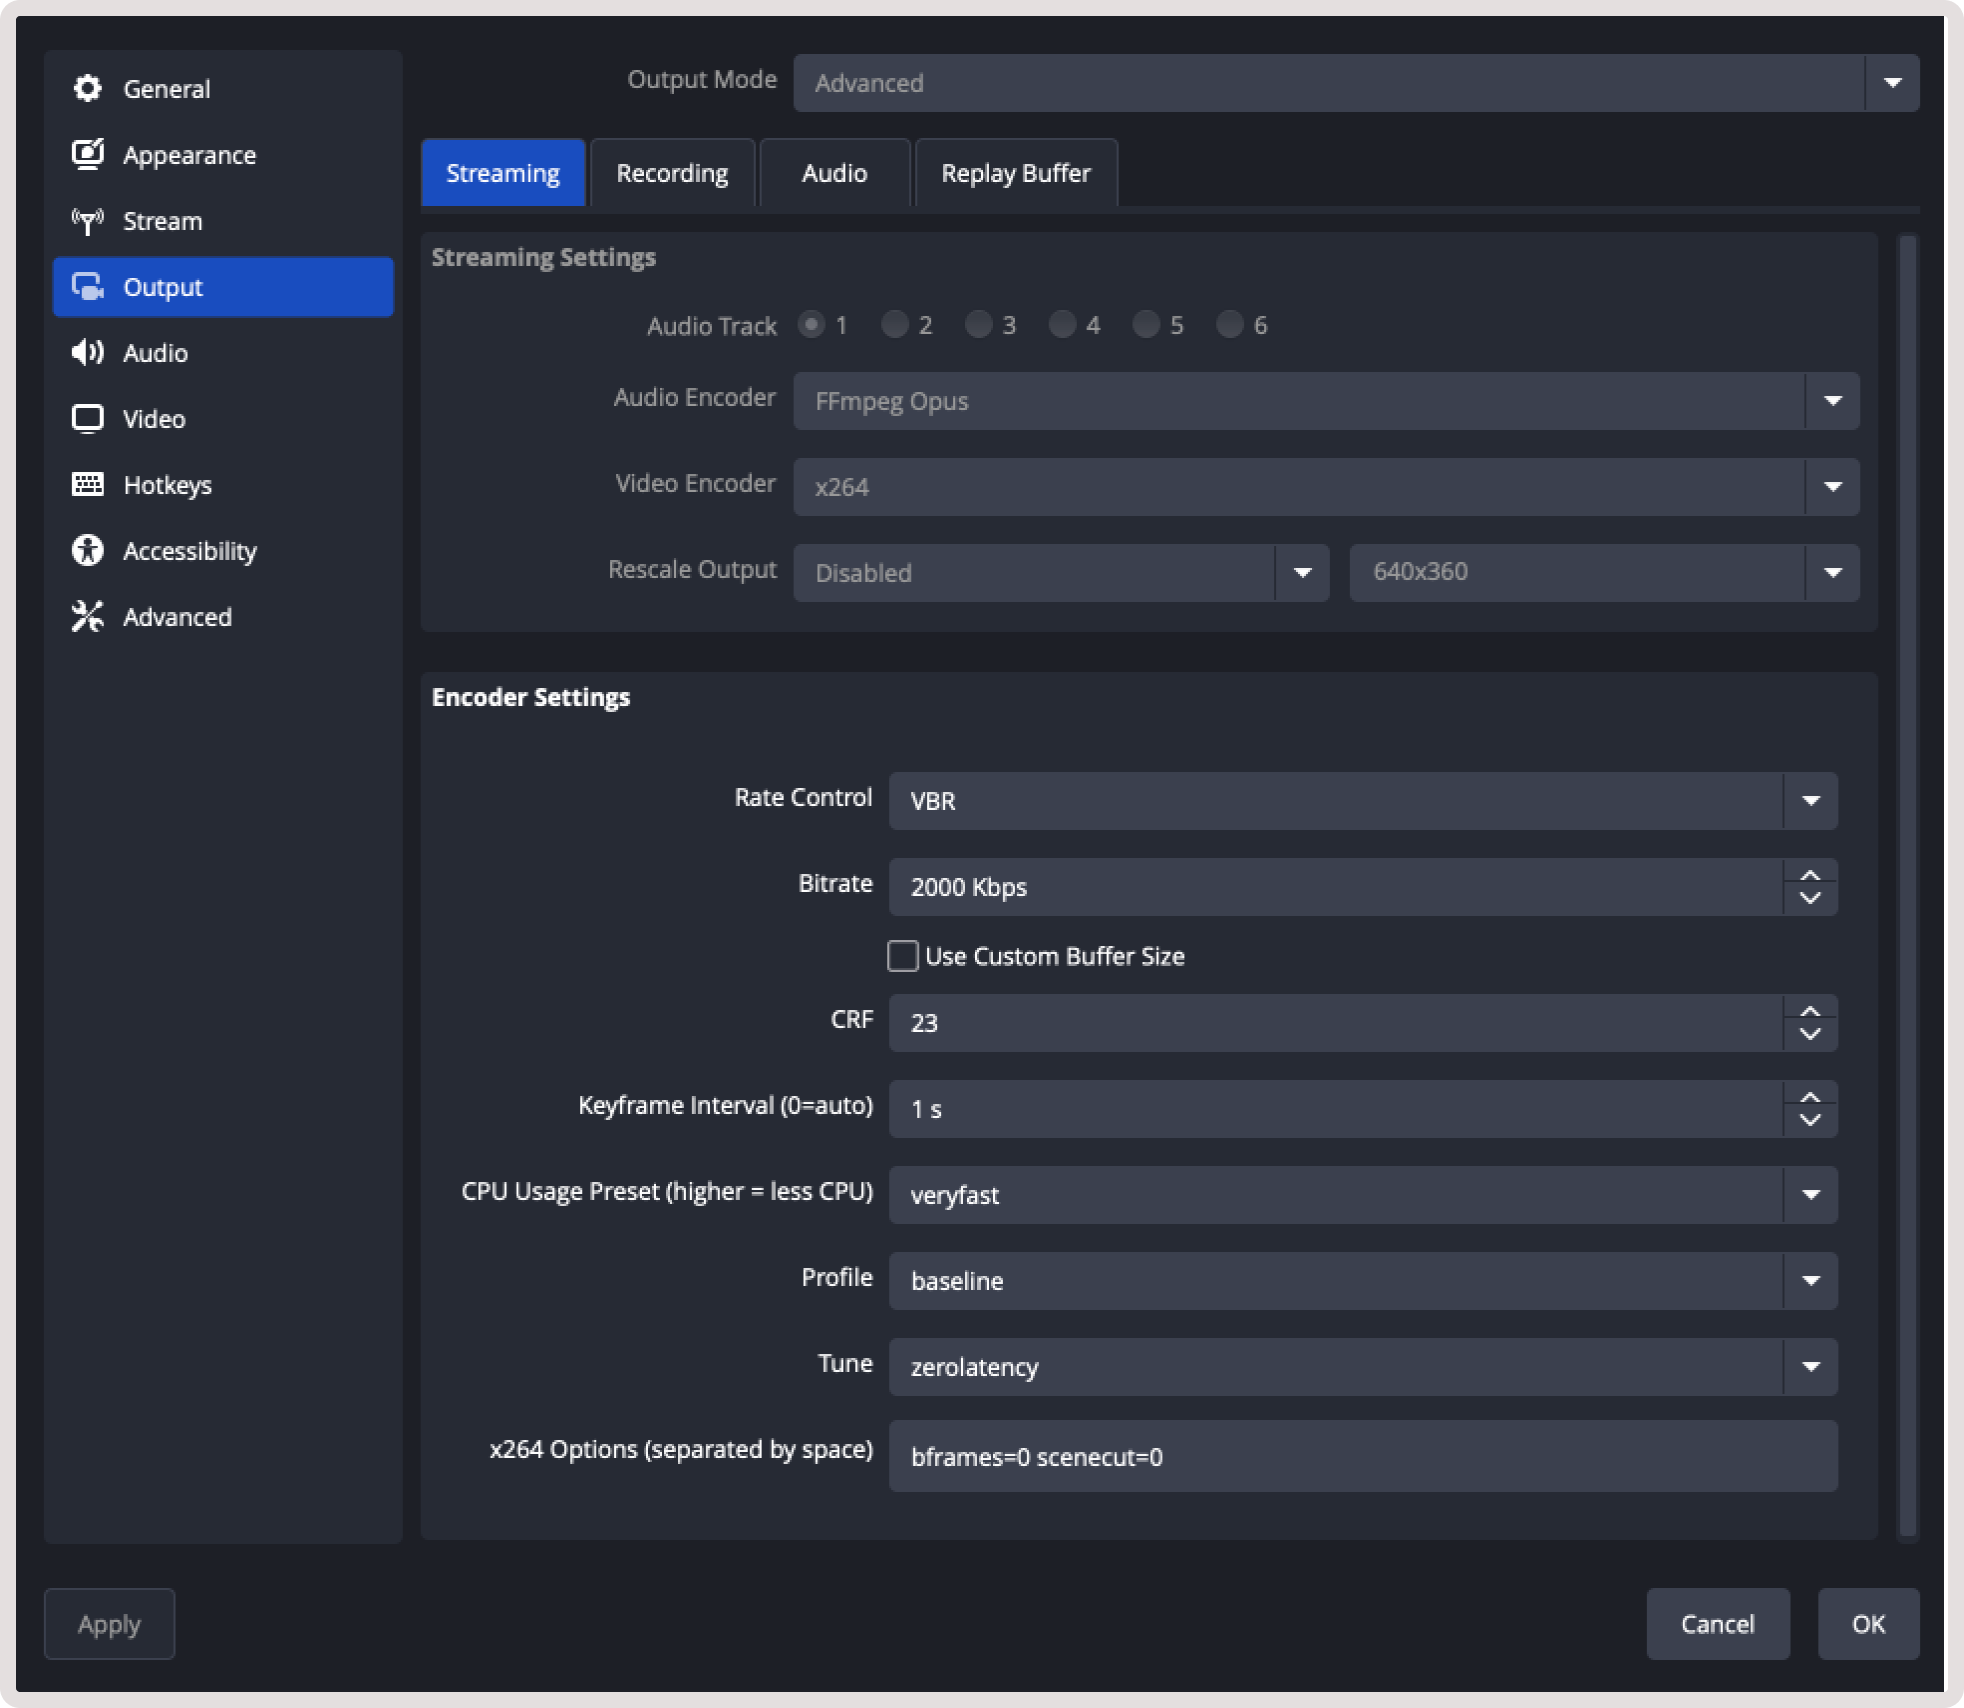
Codec H.264 with no B-frames and fast encoding:
- Encoder : x264, or any of H.264
- CPU usage : very fast
- Keyframe interval : 1 sec
- Profile : baseline
- Tune : zero latency
- x264 options : bframes=0 scenecut=0
-
Bitrate:
- The lower the bitrate, the faster the data will be transmitted to the server. Choose the optimal one for your video. For example, 1-2 Mbps is usually enough for video broadcasts of online training format or online broadcasts with a presenter.
Supported WHIP clients
You can use any libraries to send data via the WebRTC WHIP protocol.- Gcore WebRTC WHIP client
- OBS (Open Broadcaster Software)
- @eyevinn/whip-web-client
- whip-go
- Larix Broadcaster (free apps for iOS and Android with WebRTC based on Pion; SDK is available)
LL-HLS and LL-DASH outputs
Streams sent via WebRTC are transcoded in the same way as other streams received via RTMP and SRT. At the output, you can view the streams using any available protocols:- MPEG-DASH : ±2-4 seconds latency to a viewer with ABR.
- LL-HLS : ±3-4 seconds latency to a viewer with ABR.
- HLS MPEG-TS : legacy with non-low-latency (±10 seconds latency) with ABR.
TipFor more details about low-latency streaming, check out How low-latency streaming works.
Convert WebRTC to HLS in the Customer Portal
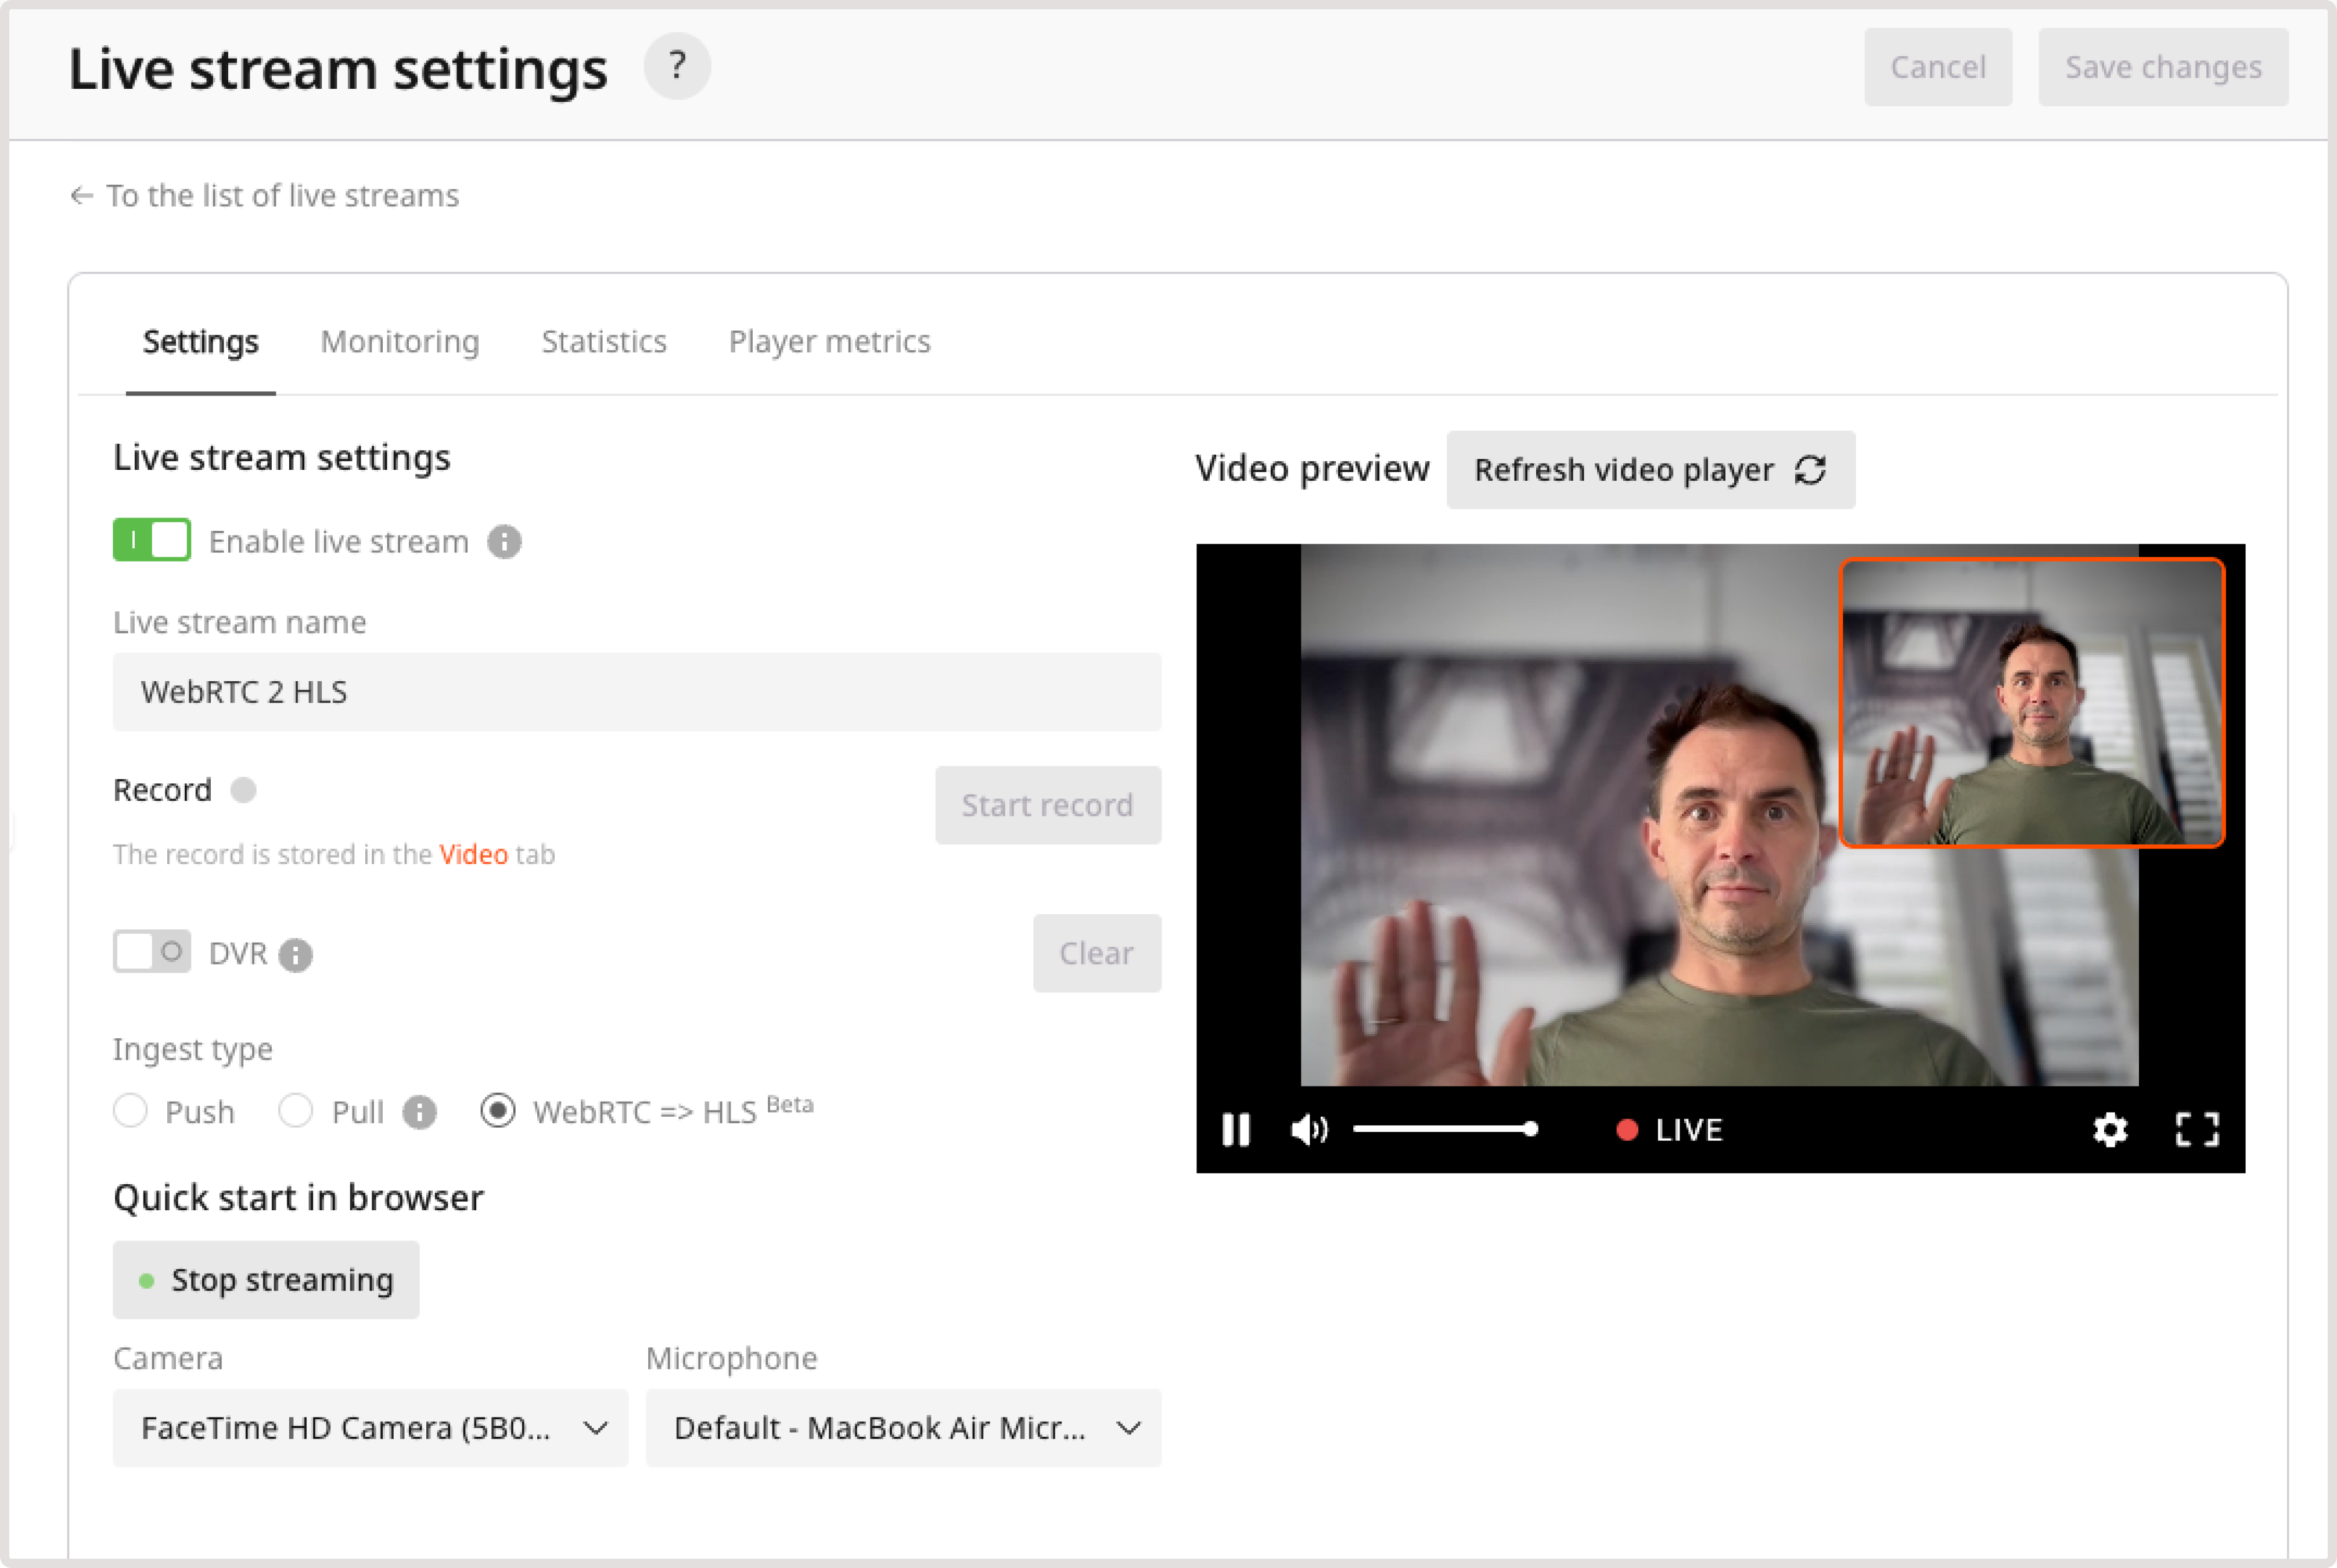
For instructions on how to convert a stream via API, refer to the API documentation. 1. In the Gcore Customer Portal, navigate to Streaming. 2. Open the Live Streaming** page and find a needed live stream. If you don’t have one, create a stream first. 3. Click the stream name to open its settings. 4. In the Quick start in browser section, click Go Live. The broadcast will start automatically.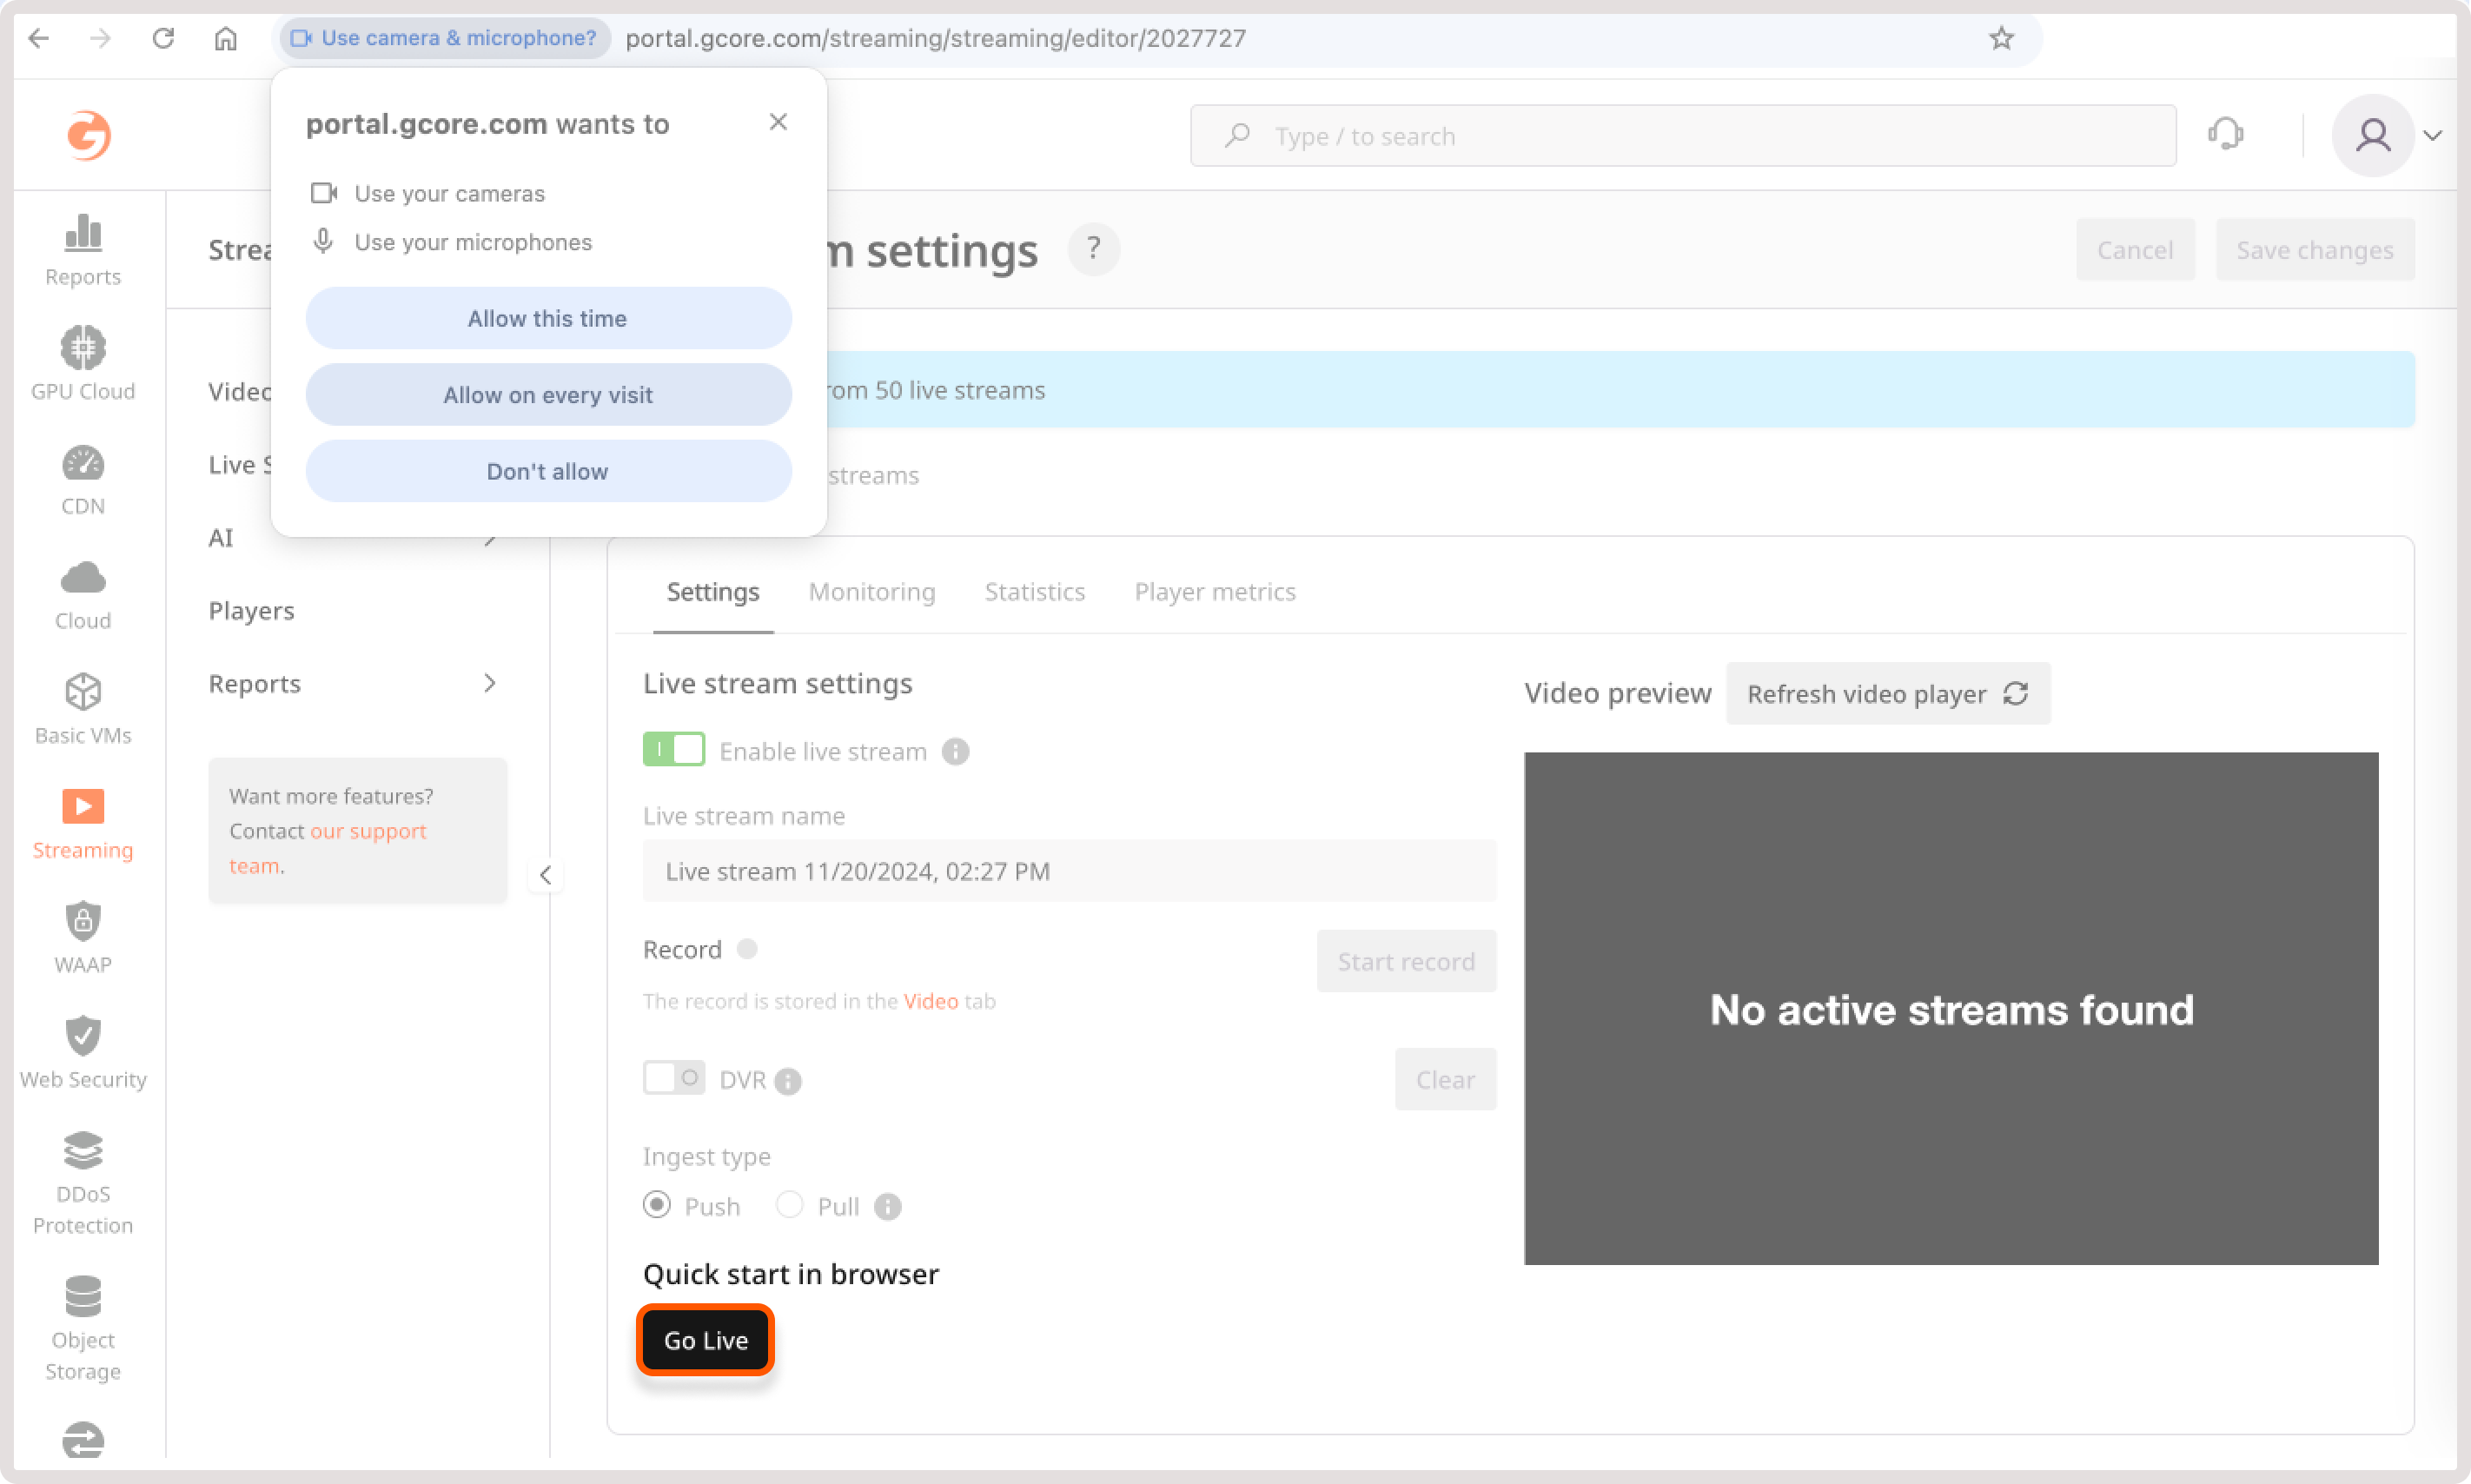
Convert WebRTC to HLS in your environment
We provide a WebRTC WHIP library for working in browsers. It implements the basic system calls and simplifies working with WebRTC:- Wrapper for initializing WebRTC stream and connecting to the server.
- Camera and mic wrapper.
- Monitoring WebRTC events and calling appropriate handlers in your code.
Start a stream with the Gcore WebRTC WHIP library
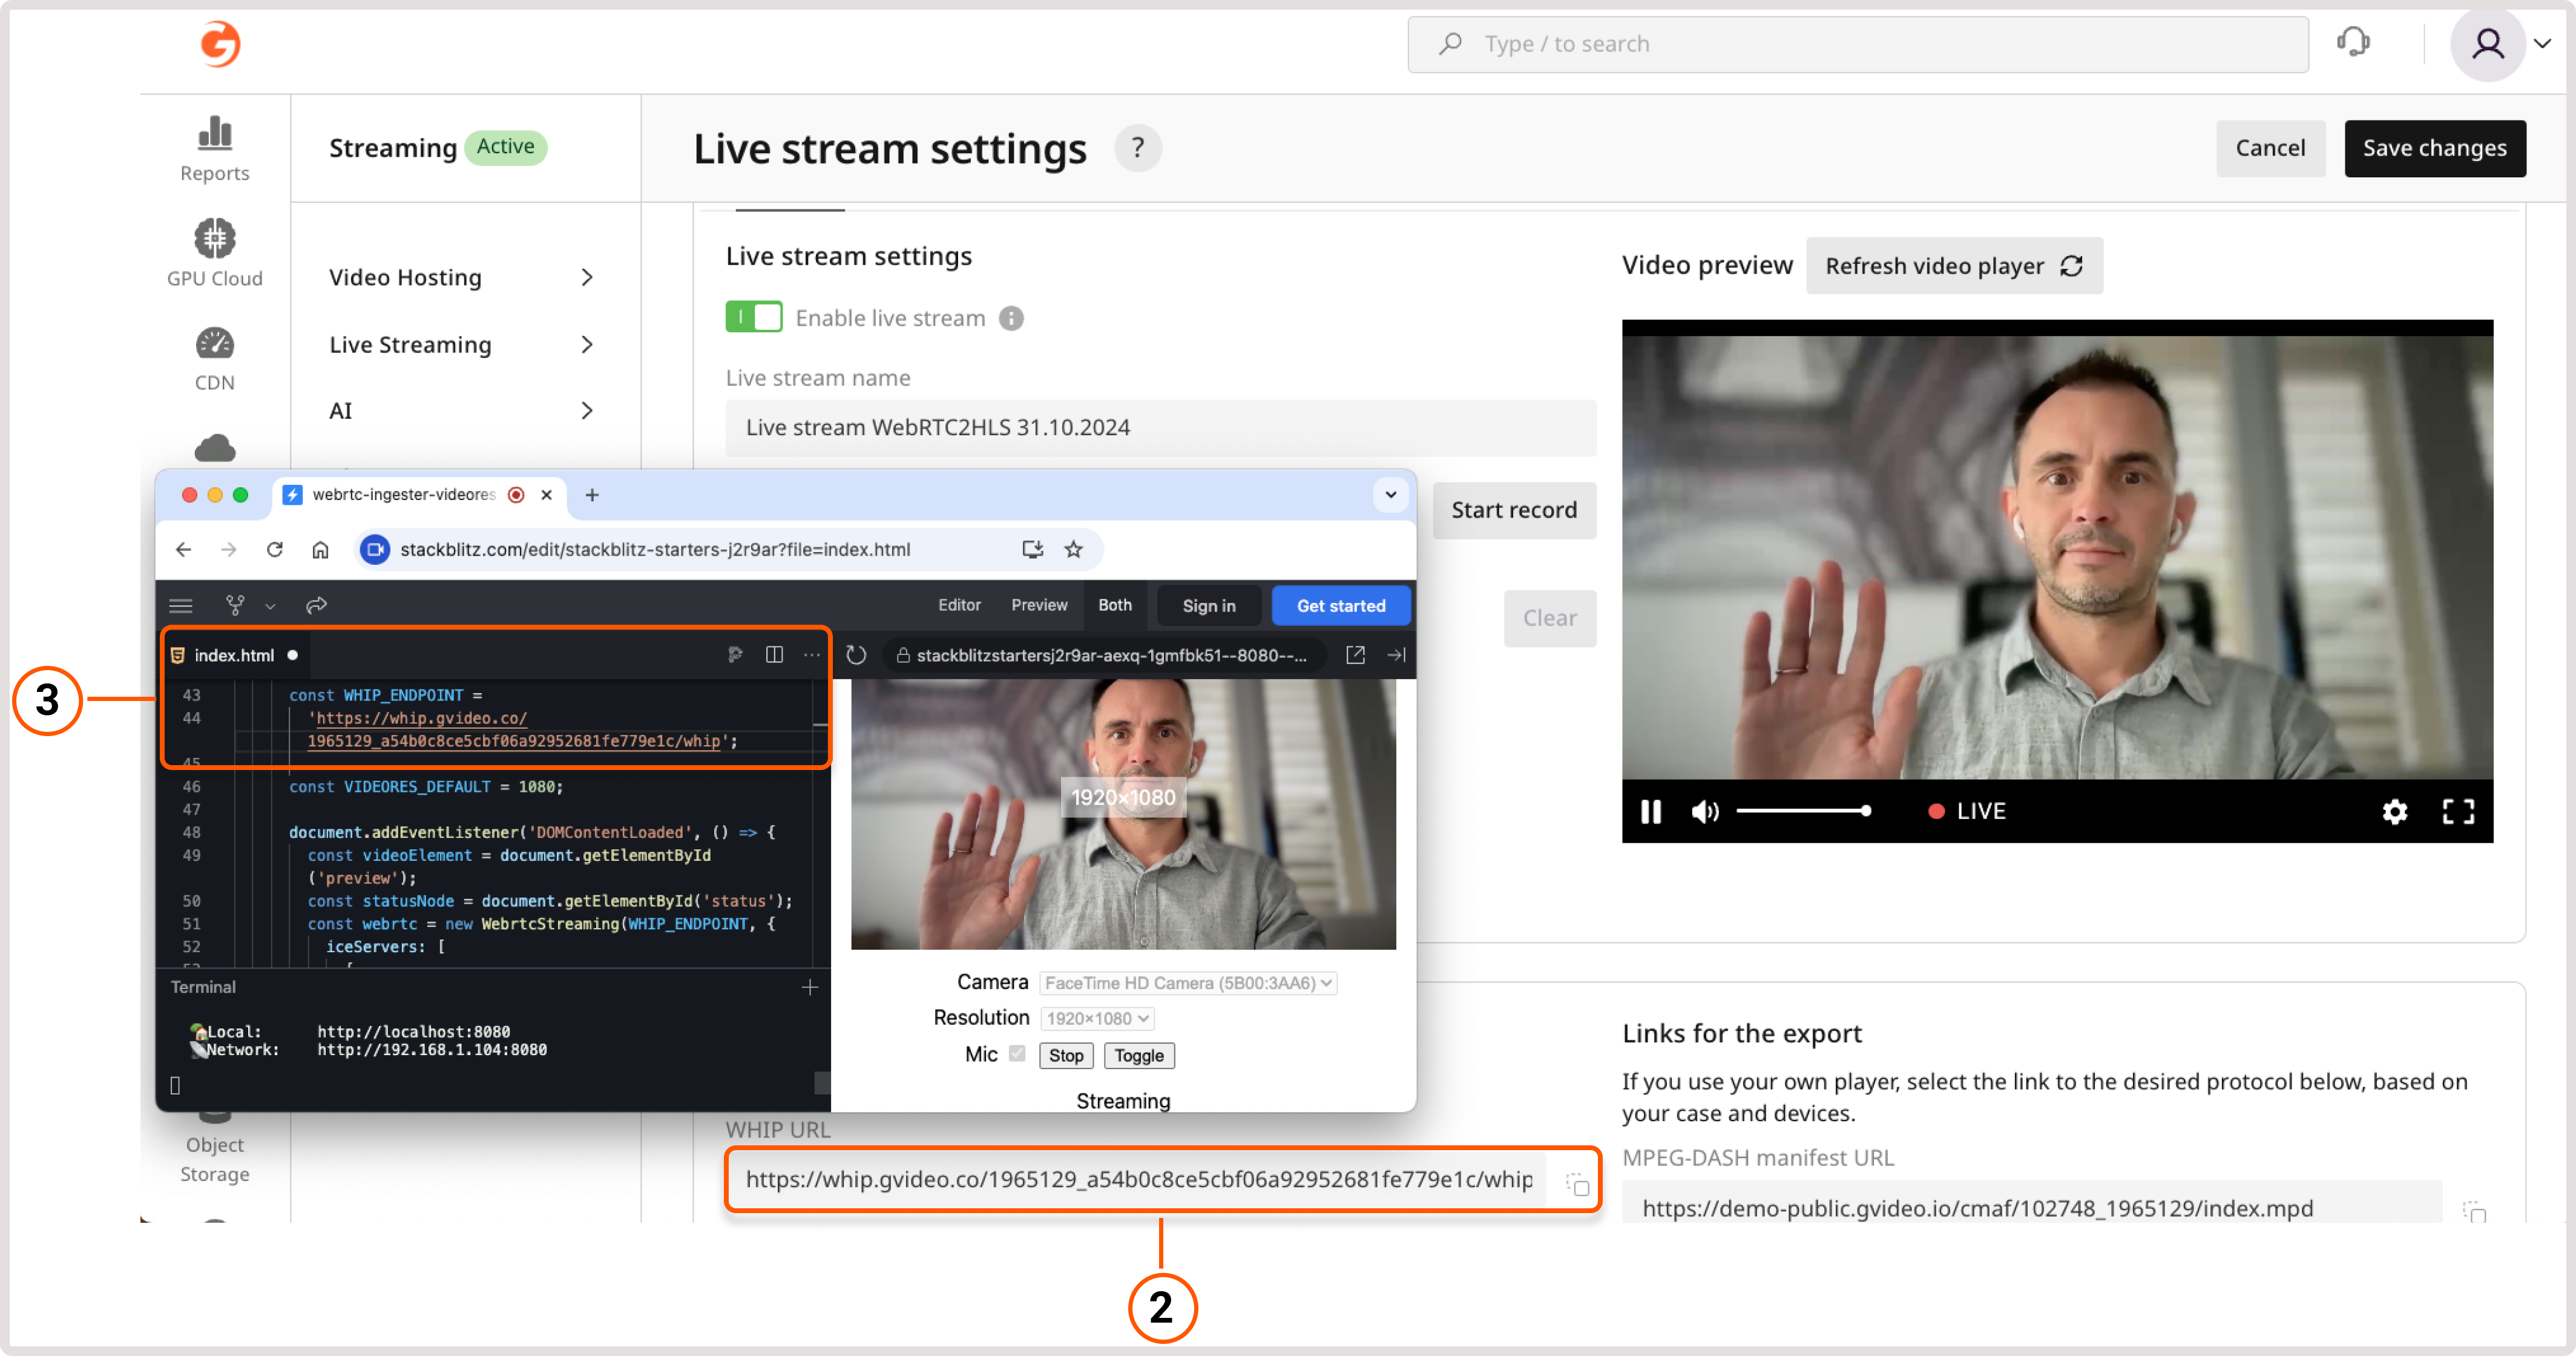
Since WHIP is an open standard, many libraries have been released for it in different languages. You can use our WebRTC WHIP or any other library specified in the WHIP clients section. Using our library, you can start the conversion with a few lines of code. To go live immediately, create a live stream in the Gcore Streaming dashboard and paste a URL into the example linked below: 1. In the Gcore Customer Portal, open the Live Streaming page. 2. Open the stream settings and copy a WHIP URL from the WebRTC = > HLS parameters section. 3. Open WHIP demo app and paste the WHIP URL into theWHIP_ENDPOINT const.
Start a stream with your own backend or frontend
To create a new stream, send a POST request to the following endpoint: Example response:Use the
https://api.gcore.com/streaming/streams.Example request:"push_url_whip" value from the response to start the stream.Play HLS or DASH
After sending the stream from frontend, the stream will start transcoding. In ±2-7 seconds, the HLS and MPEG-DASH versions will be ready for viewing. The stream can be viewed through the built-in web player or using direct links to the manifests. You can take these links from the API response. Examples:- Web player: https://player.gvideo.co/streams/102748_1965207
- LL-HLS manifest: https://102748.gvideo.io/cmaf/102748_1965207/master.m3u8
- DASH manifest: https://102748.gvideo.io/cmaf/102748_1965207/index.mpd
https://api.gcore.com/streaming/streams/{id}.
Example request:
Deactivate a finished stream
Update the stream by sending a PATCH request to the following endpoint: Alternatively, you can delete the stream by sending the DELETE request to
https://api.gcore.com/streaming/streams/{id}.Example request:https://api.gcore.com/streaming/streams/$id.Example request:Demo projects of streaming with frontend and backend
You can find a detailed description of this version above. To view the full code, inspect the https://stackblitz.com/edit/stackblitz-starters-j2r9ar?file=index.html.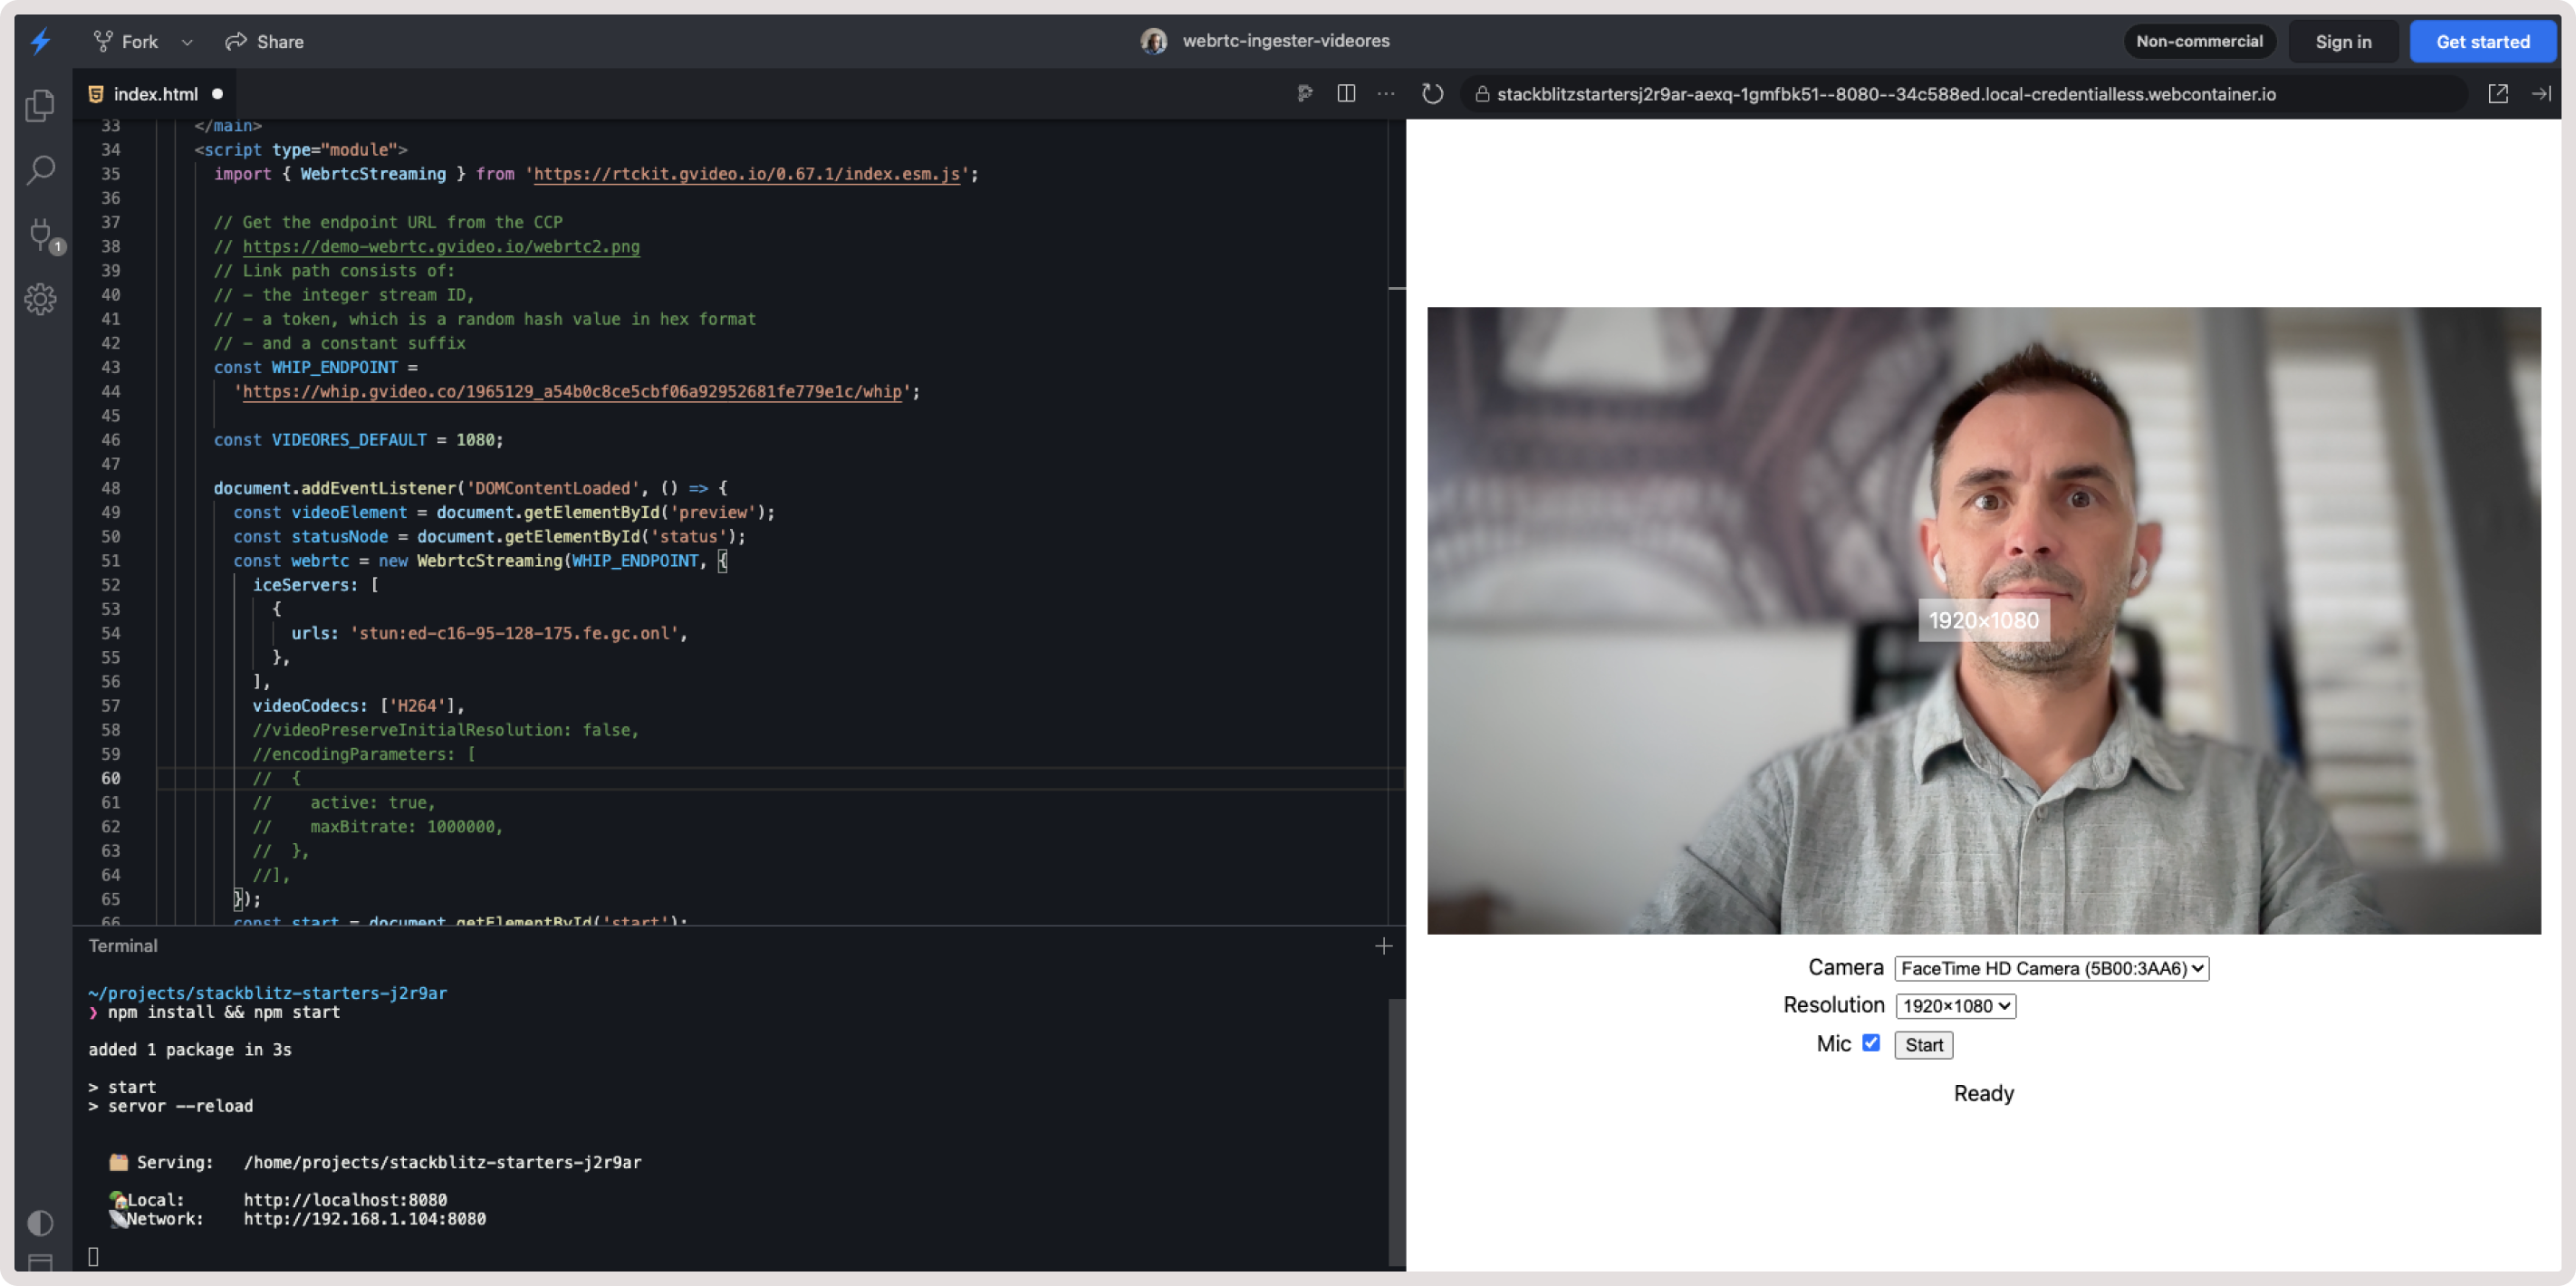
Troubleshooting
If you experience issues related to our streaming service, check out the following sections. They outline common problems and recommended resolution steps.Error handling
NetworkError For details, refer to NetworkError class. The ingestion service is unavailable or is unreachable from the client’s network. The error message includes a description of the error cause. In such cases, the application should render itself unavailable and report the error to Gcore support. The app should not retry the operation, as the retry logic is already implemented in the SDK. ServerRequestError For details, check out ServerRequestError class. The ingestion server returned an error, which can be identified by inspecting thestatus and detail fields of the error object.
Typical cases for ServerRequestError
Typical cases for ServerRequestError
| HTTP status code | Explanation | Example |
|---|---|---|
| 400 | The client’s request is wrong. It may be due to the incorrect request parameters sent by the WHIP client. If you see this error with an unintelligible description or with no description at all, contact the Gcore support team. A special case to note is when multiple clients attempt to stream to the same endpoint simultaneously. Check the example for details. | err.message: Server request failed with status 400 err.status: 400 err.detail: {"error": "someone is already publishing to the path '1960197_XXX'"} |
| 403 | The endpoint you are trying to connect to is unreachable. Probable causes:
| err.message: Server request failed with status 403 err.status: 403 |
| 500, 502, 503, 504, 5xx (infrequently) | Gcore infrastructure is experiencing pressure or outage. Contact the Gcore support team. The app should render itself unavailable. It should not retry the request. | err.message: Server request failed with status 504 err.status: 504 |
Typical cases for TimeoutError
Typical cases for TimeoutError
| Error message | Explanation |
|---|---|
| Timeout waiting for ICE candidates | Cause 1. Incorrectly configured ICE servers. The default configuration (when no ICE servers are specified) is to fetch a list of them from the WHIP endpoint. Cause 2. ICE servers fetched from the WHIP endpoint are unreachable from your client’s location. This is very unlikely to happen. In both cases, start by checking the ICE servers your WebRTC uses as described in the Network troubleshooting section. If that doesn’t work, contact the Gcore support team. The client app should render itself unavailable due to network conditions as an explanation. |
Sudden disconnection of camera or microphone
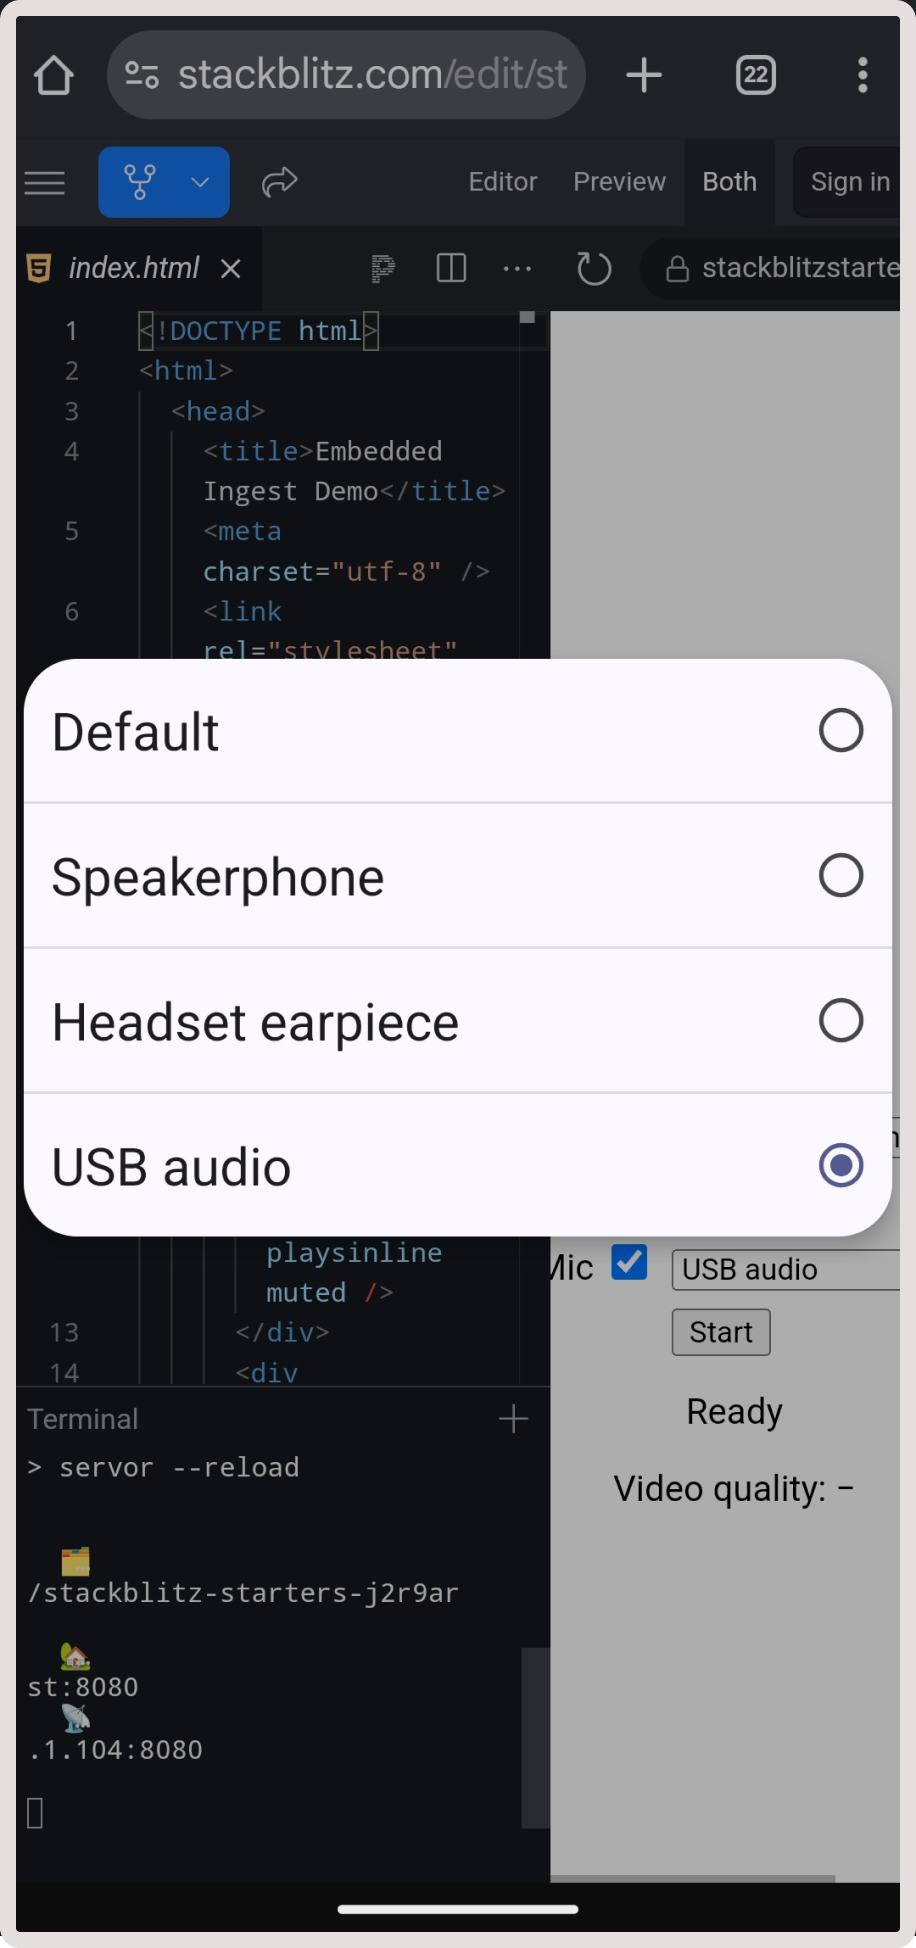
Sometimes, users use external or plug-in cameras and microphones, and these devices can be disconnected at any time. For example:- A USB camera cable might be unplugged.
- AirPods may be placed back in their case.
mediaDevicesAutoSwitch option and subscribe to the event:
- set mediaDevicesAutoSwitch: true
- catch WebrtcStreamingEvents
Debugging with Chrome WebRTC internals tool
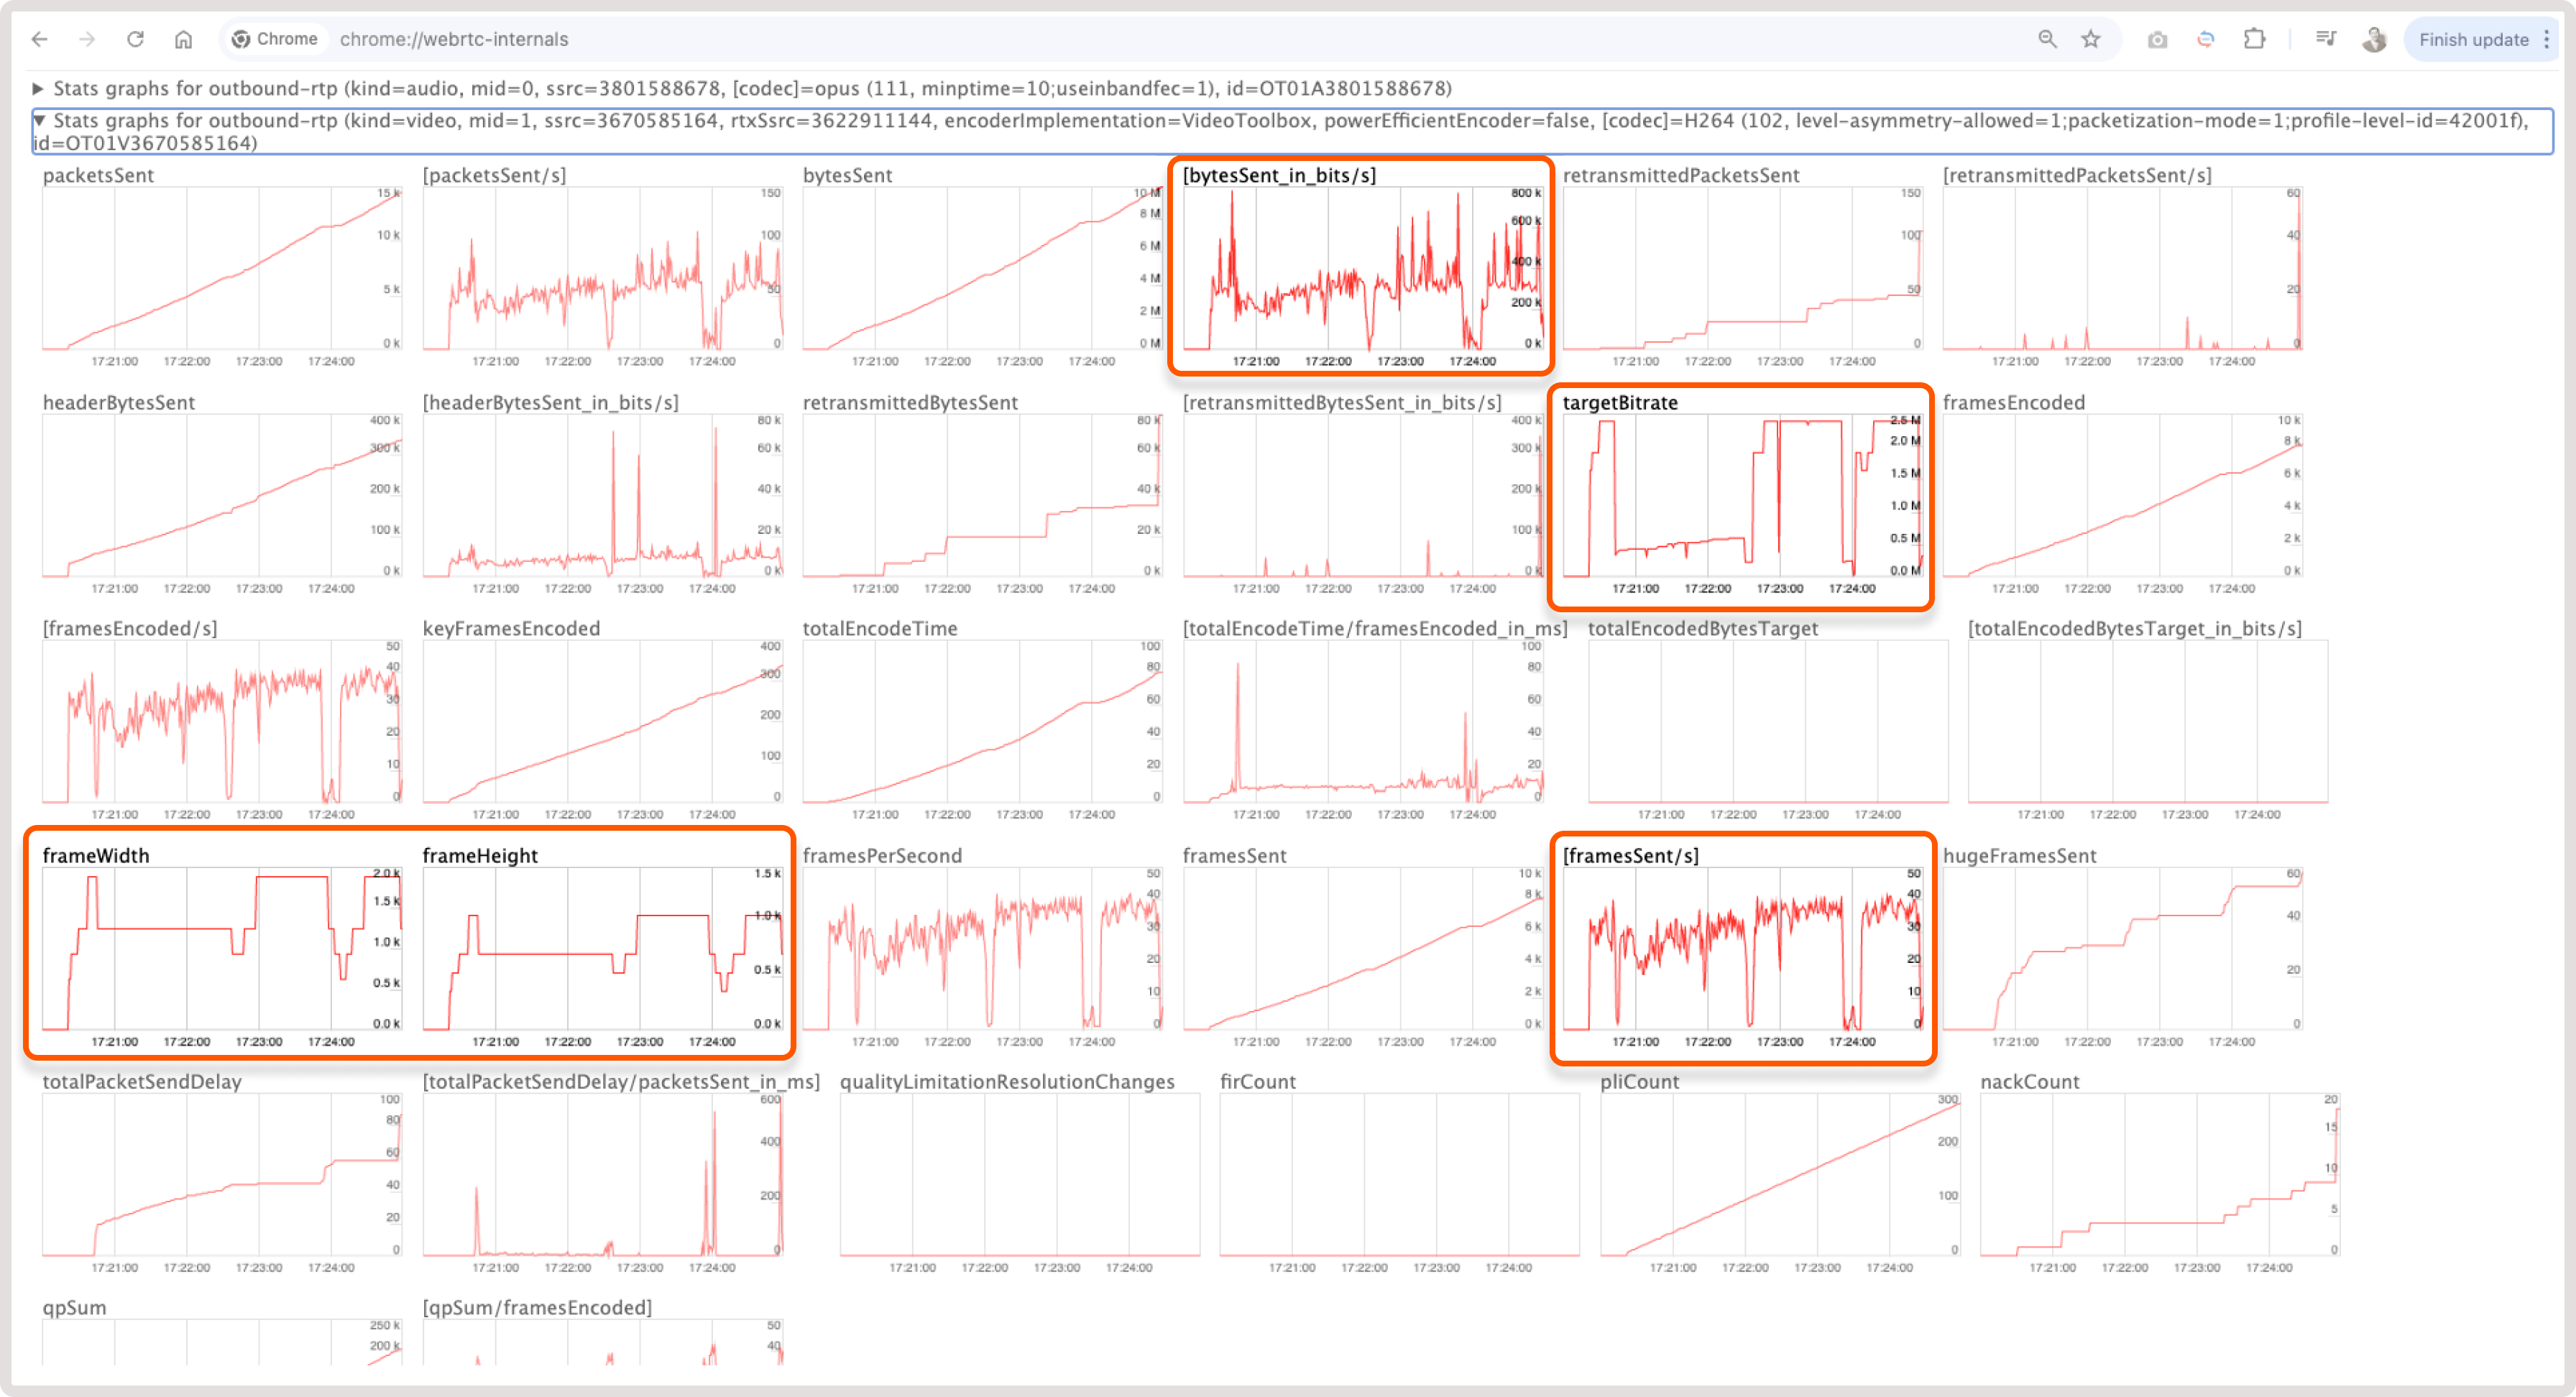
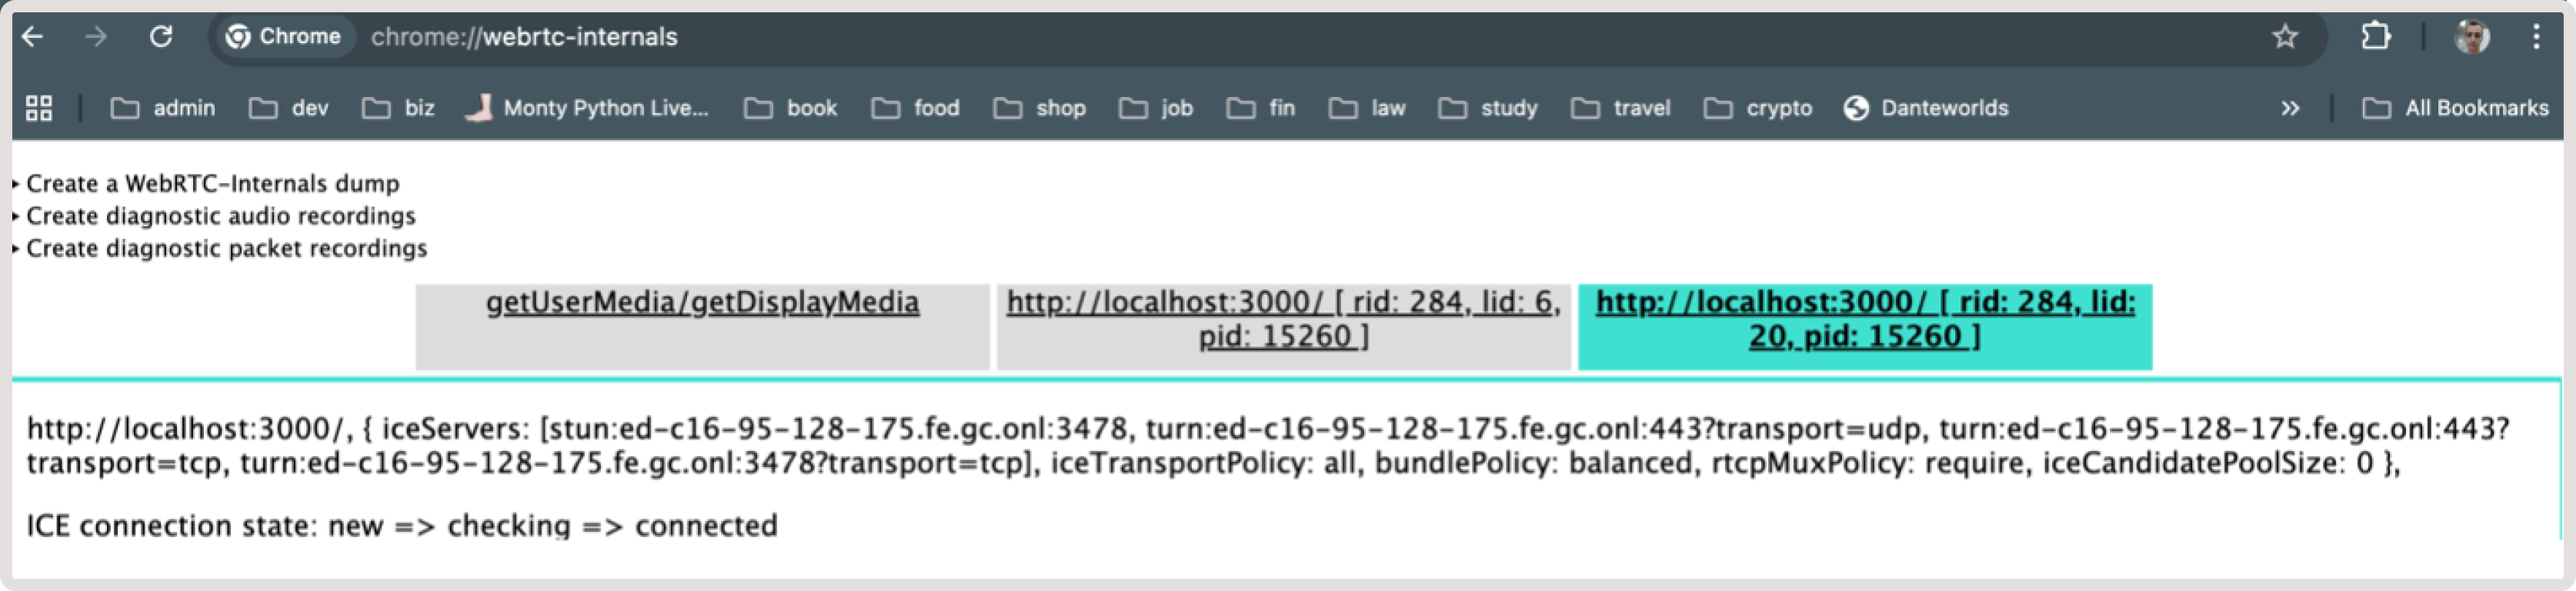
Chrome is really good at working with WebRTC because it has a built-in tool to help developers see how things are working. Chrome v87+ has a special page called chrome://webrtc-internals where you can check your WebRTC calls: 1. Open a new Chrome tab and navigate to chrome://webrtc-internals while you’re in a WebRTC call. On this page, you can view detailed information about the video and audio streams, connection setup, and more. 2. Use the provided information to find potential problems. For instance, when videos won’t play, calls won’t connect, or videos are slow. One of the parameters you can monitor in Stats graphs for candidate-pair:- AvailableOutgoingBitrate
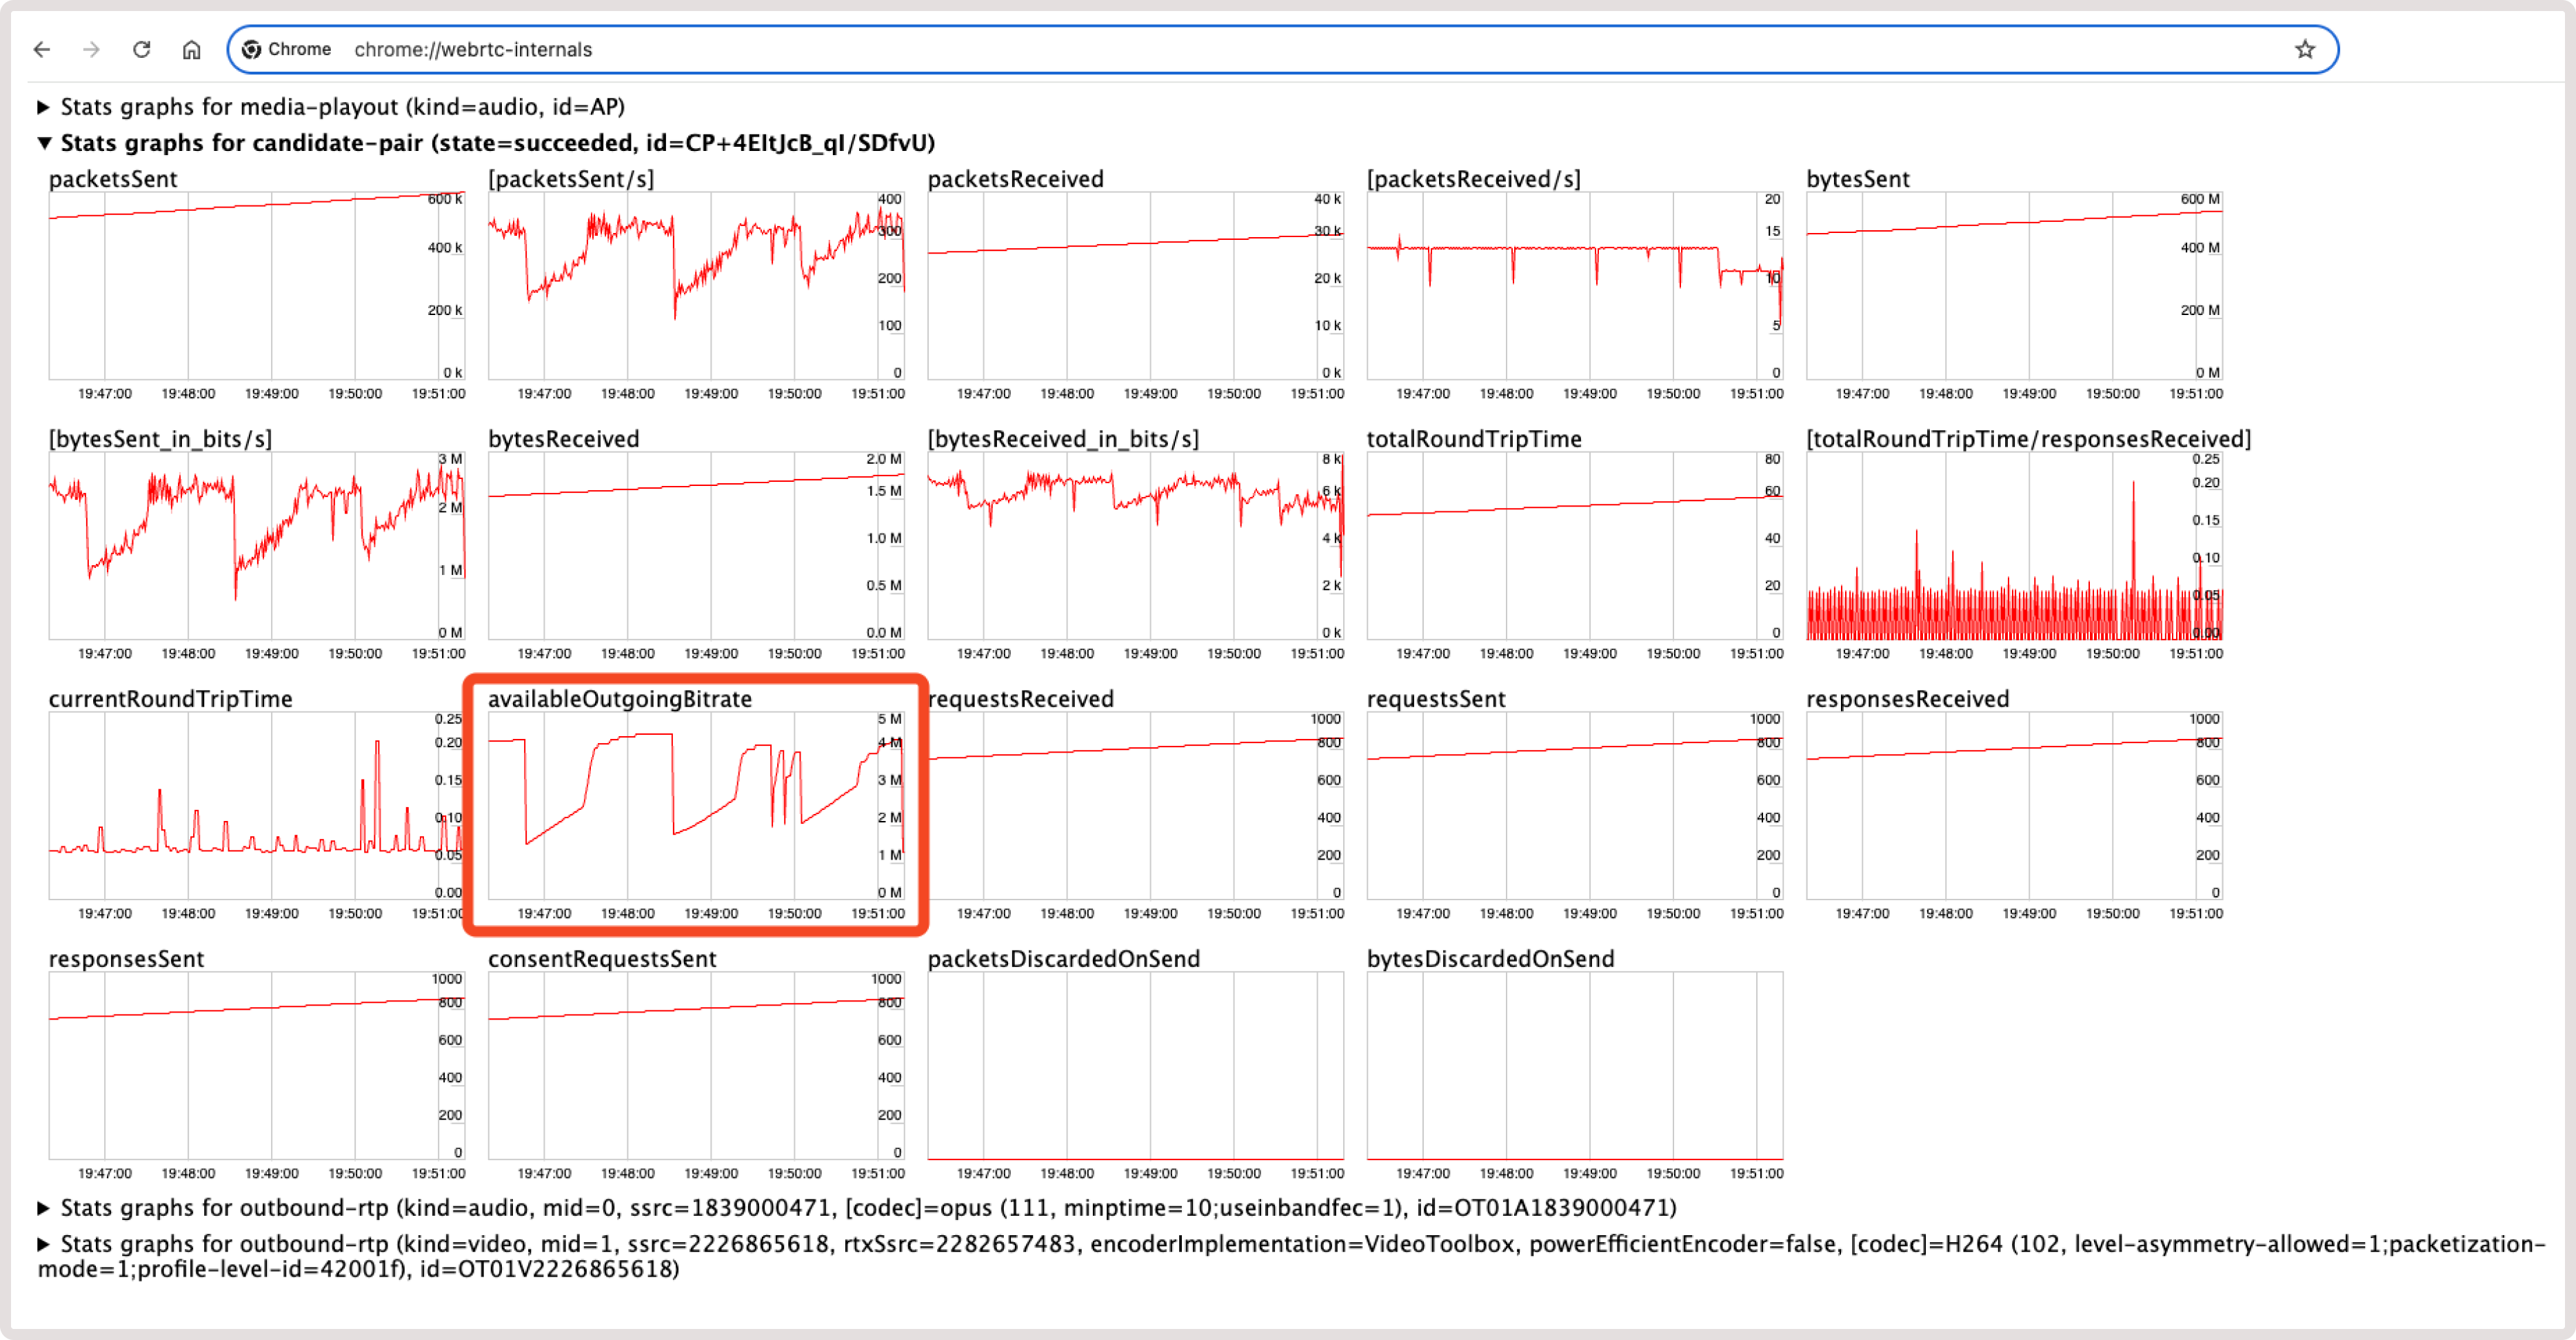
- bytesSent_in_bits/s
- targetBitrate
- frameWidth
- frameHeight
- framesSent/s
Network troubleshooting
Video stream is poorly transcoded or constantly stops
If a stream in the player constantly stops, is interrupted, or has poor quality, the issue is likely related to slow transmission of the original stream from a presenter via WebRTC. WebRTC is very demanding of the quality of internet connection from client to server. At the same time, standard implementations take into account many parameters on a local device, which can cause slower transmission of data or even stop it altogether until conditions are improved. To diagnose such situations: 1. Use the VideoResolutionChangeDetector plugin. It allows you to show a message about bad network conditions on a viewer’s device. 2. Use Chrome’s WebRTC debug tool that’s available via this link: chrome:\webrtc-internals. Network congestion, occurring when resource demand surpasses capacity, leads to packet loss, increased latency, and jitter, hindering real-time communication, with congestion control algorithms optimizing performance by regulating data packet flow. You can read how WebRTC uses Transport Wide Congestion Control (TWCC) to control it in thearticle about TWCC. The available bitrate is calculated in the availableOutgoingBitrate parameter, which indicates the available outbound capacity of the network connection. The higher the value, the more bandwidth you can assume is available for outgoing data. The value is reported in bits per second and is computed over a 1-second interval. The most likely scenario for quality degradation occurs here when the channel width becomes insufficient to send good resolution. However, sometimes the connection is even worse when packets are lost. In this case, the server starts sending NACK (Negative Acknowledgement) packets. You can read more about this issue in the NACK overview article. More and more data start to be resent, which leads to increased latency or gaps in frames. In this case, the transcoder doesn’t receive frames on time, causing the video to interrupt or stop altogether. You can monitor and debug this issue in Chrome’s webrtc-internals tool: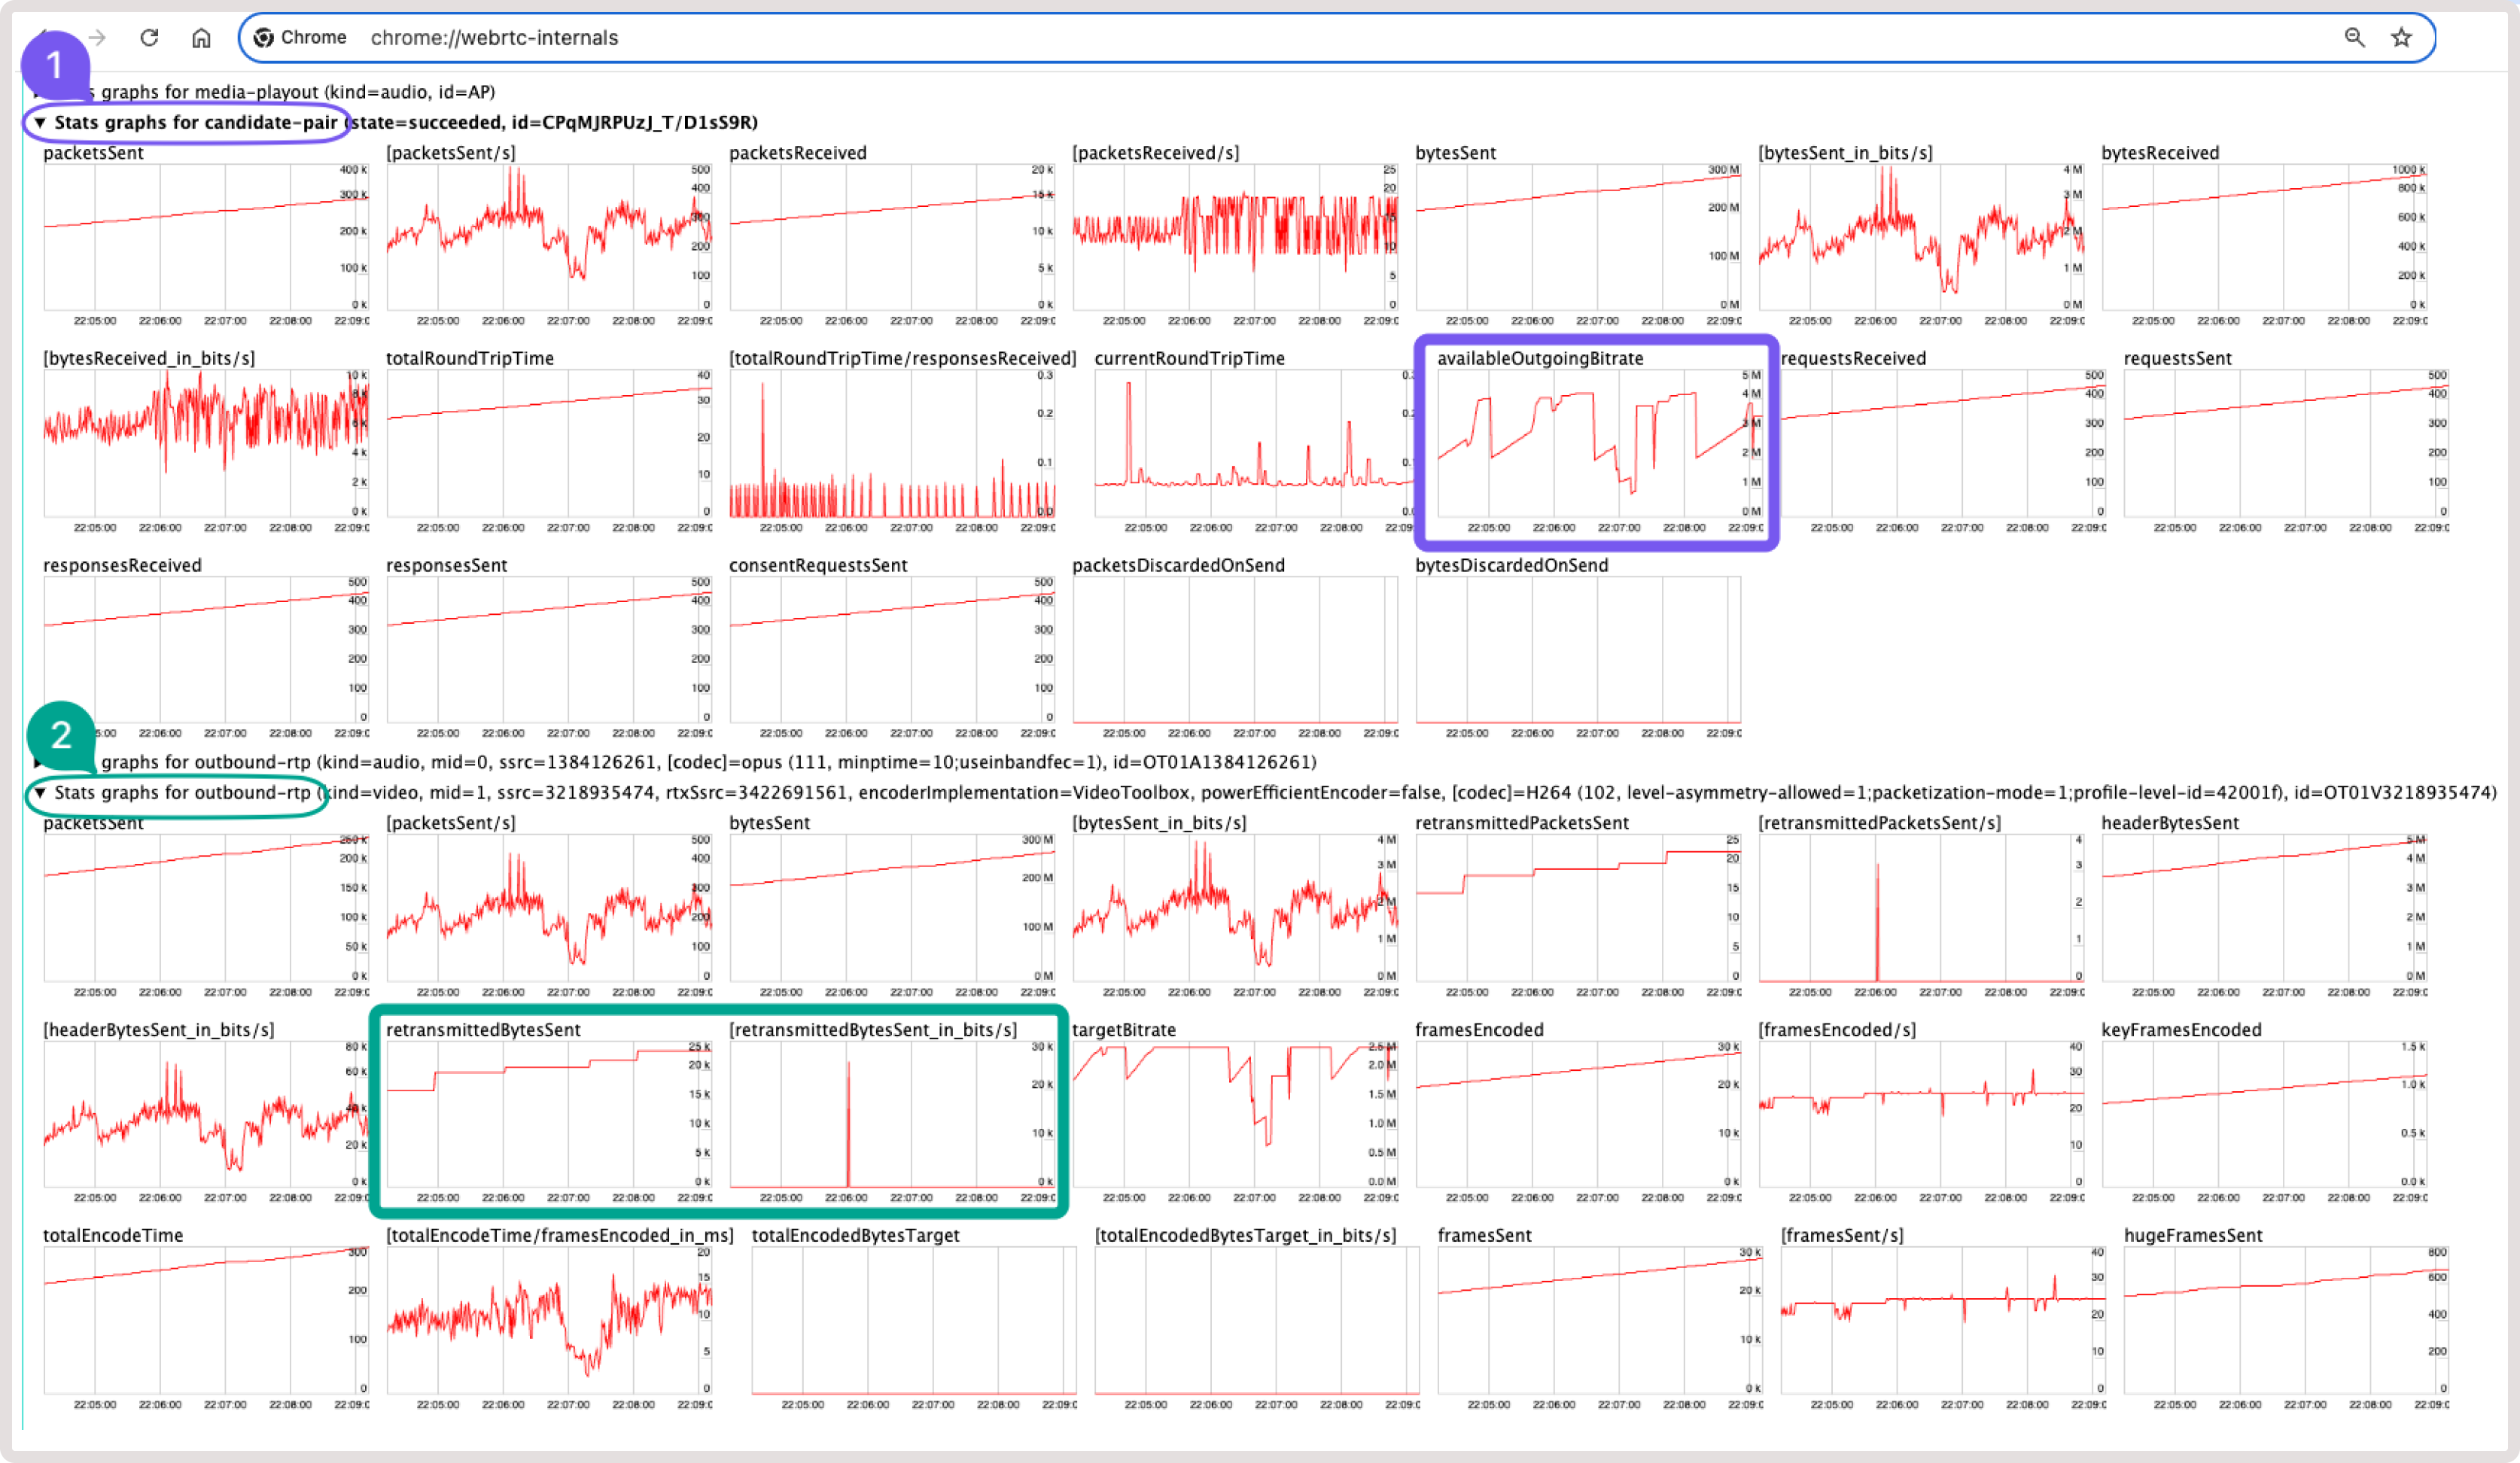
- Always show users a message about changed conditions. In 99% of cases, the issue is related to the user’s internet conditions.
- Use TCP as the delivery protocol instead of UDP.
- Use the TURN server for delivery instead of sending directly to the media server.
Issues with ICE servers
If you experience problems with timeout waiting for an ICE candidate, check your ICE server configuration. ICE servers used by the WHIP client can be configured explicitly using the iceServers configuration option. Otherwise, they are fetched from Gcore’s media server in the response to a session initiation request. In the case of the latter, check what the server returns in theLink headers. For example:
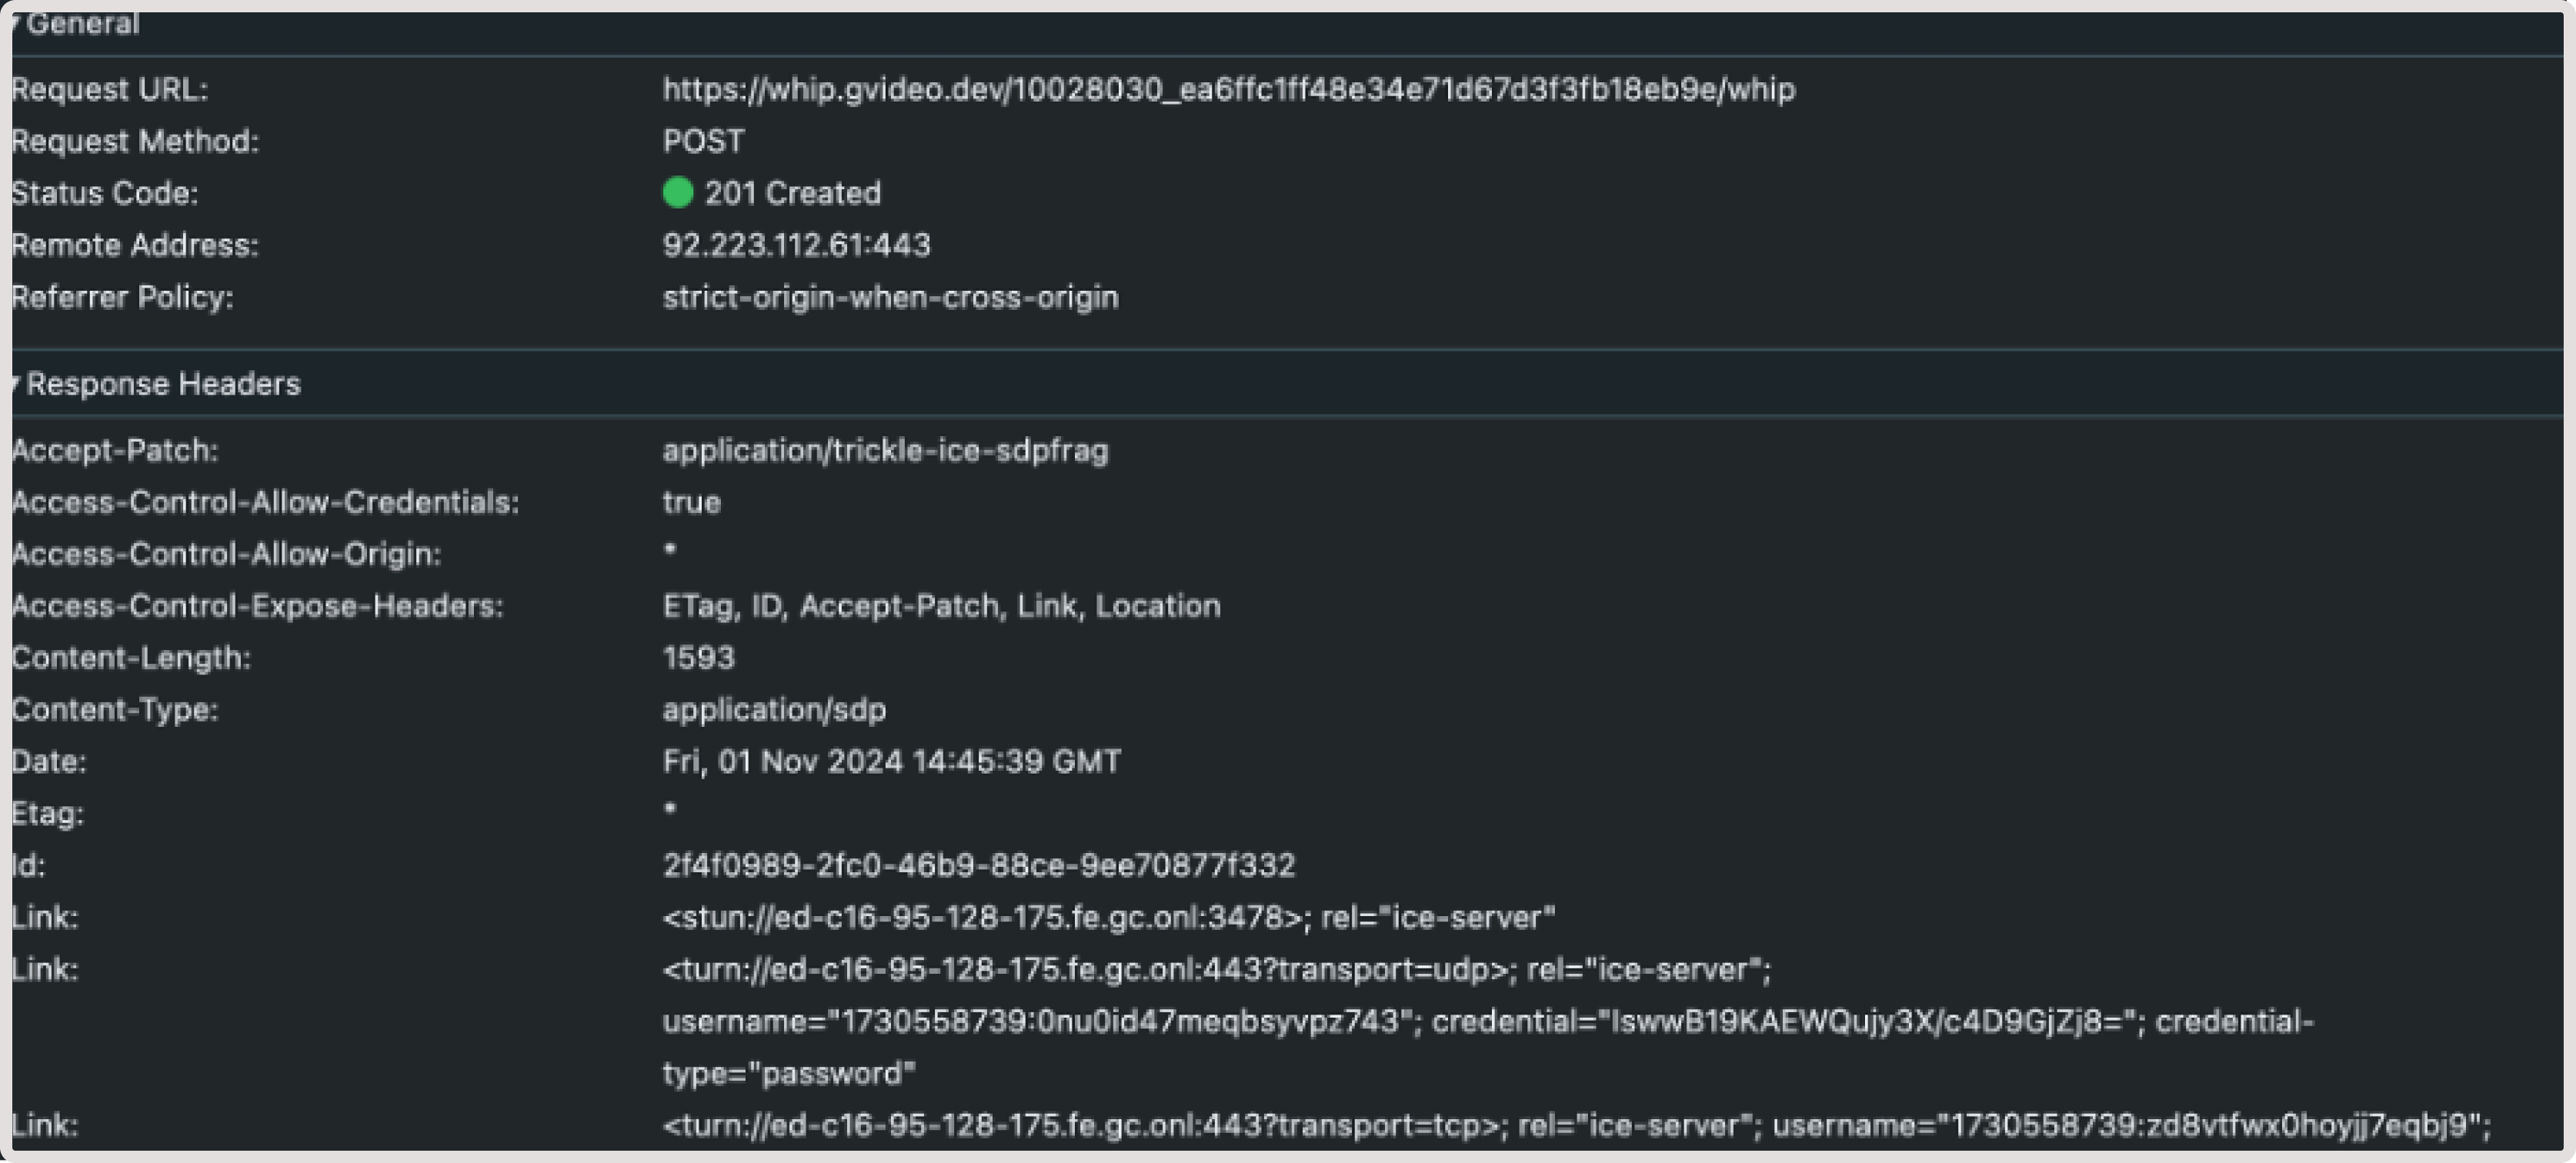
- A srvrflx candidate for STUN server
- A relay candidate for a TURN server